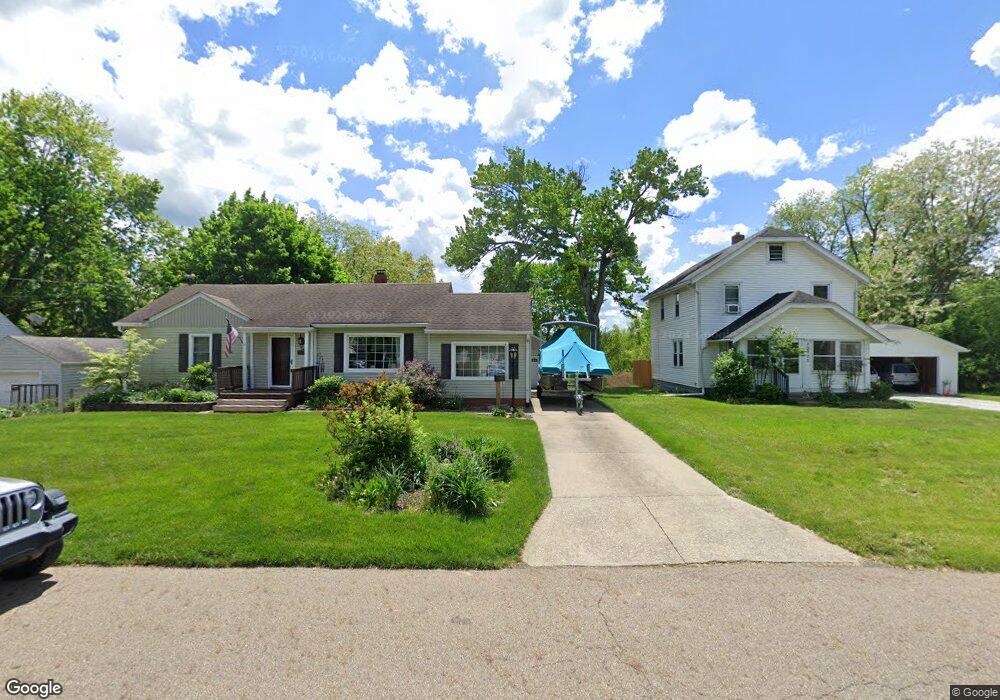
2769 Nesmith Lake Blvd Akron, OH 44314
Kenmore NeighborhoodEstimated Value: $132,000 - $173,000
2
Beds
1
Bath
1,200
Sq Ft
$126/Sq Ft
Est. Value
About This Home
This home is located at 2769 Nesmith Lake Blvd, Akron, OH 44314 and is currently estimated at $151,587, approximately $126 per square foot. 2769 Nesmith Lake Blvd is a home located in Summit County with nearby schools including St. Francis de Sales School and Sam Salem Community Learning Center.
Ownership History
Date
Name
Owned For
Owner Type
Purchase Details
Closed on
Feb 27, 2017
Sold by
Alchier John E
Bought by
Potter Julie M and Alchier Julie M
Current Estimated Value
Purchase Details
Closed on
Feb 16, 2007
Sold by
Zupancic Michael J and Zupancic Michelle M
Bought by
Alchier John E and Potter Julie M
Home Financials for this Owner
Home Financials are based on the most recent Mortgage that was taken out on this home.
Original Mortgage
$121,506
Outstanding Balance
$73,221
Interest Rate
6.27%
Mortgage Type
Purchase Money Mortgage
Estimated Equity
$78,366
Purchase Details
Closed on
Jan 25, 1999
Sold by
Juhasz Charles D and Juhasz Christina M
Bought by
Zupancic Michael J and Zupancic Michelle M
Home Financials for this Owner
Home Financials are based on the most recent Mortgage that was taken out on this home.
Original Mortgage
$82,175
Interest Rate
6.8%
Create a Home Valuation Report for This Property
The Home Valuation Report is an in-depth analysis detailing your home's value as well as a comparison with similar homes in the area
Home Values in the Area
Average Home Value in this Area
Purchase History
| Date | Buyer | Sale Price | Title Company |
|---|---|---|---|
| Potter Julie M | -- | None Available | |
| Alchier John E | $116,000 | Cardinal First Title Inc | |
| Zupancic Michael J | $86,500 | Exchange Place Title Agency |
Source: Public Records
Mortgage History
| Date | Status | Borrower | Loan Amount |
|---|---|---|---|
| Open | Alchier John E | $121,506 | |
| Previous Owner | Zupancic Michael J | $82,175 |
Source: Public Records
Tax History Compared to Growth
Tax History
| Year | Tax Paid | Tax Assessment Tax Assessment Total Assessment is a certain percentage of the fair market value that is determined by local assessors to be the total taxable value of land and additions on the property. | Land | Improvement |
|---|---|---|---|---|
| 2025 | $1,975 | $36,474 | $8,145 | $28,329 |
| 2024 | $1,975 | $36,474 | $8,145 | $28,329 |
| 2023 | $1,975 | $36,474 | $8,145 | $28,329 |
| 2022 | $1,835 | $26,523 | $5,901 | $20,622 |
| 2021 | $1,837 | $26,523 | $5,901 | $20,622 |
| 2020 | $1,933 | $26,520 | $5,900 | $20,620 |
| 2019 | $2,276 | $28,960 | $6,440 | $22,520 |
| 2018 | $2,247 | $28,960 | $6,440 | $22,520 |
| 2017 | $2,299 | $28,960 | $6,440 | $22,520 |
| 2016 | $2,334 | $29,690 | $6,440 | $23,250 |
| 2015 | $2,299 | $30,950 | $6,440 | $24,510 |
| 2014 | $2,281 | $30,950 | $6,440 | $24,510 |
| 2013 | $2,386 | $33,150 | $6,440 | $26,710 |
Source: Public Records
Map
Nearby Homes
- 2785 Nesmith Lake Blvd
- 2531 Pelton Ave
- 2513 Christensen Ave
- 32 Joyce Ave
- 364 Rexford St
- 0 Joyce Ave NW Unit 35 5043152
- 0 Joyce Ave NW Unit 34 5043158
- 2984 Manchester Rd
- 363 Lockwood St
- 355 Lockwood St
- 2365 Pelton Ave
- 594 Shook Rd
- 2996 Kemble Ave
- 838 Stanwood Ave
- 2836 Unclmorse Ave
- 2784 Conway St
- 860 Sutherland Ave
- 55 W Ralston Ave
- 451 Allenford St
- 894 Sutherland Ave
- 2775 Nesmith Lake Blvd
- 2765 Nesmith Lake Blvd
- 2774 Nesmith Lake Blvd
- 2770 Nesmith Lake Blvd
- 2764 Nesmith Lake Blvd
- 2755 Nesmith Lake Blvd
- 2758 Nesmith Lake Blvd
- 2695 Edwin Ave
- 2792 Nesmith Lake Blvd
- 2751 Nesmith Lake Blvd
- 2691 Edwin Ave
- 2714 Christensen Ave
- 2799 Nesmith Lake Blvd
- 2687 Edwin Ave
- 2743 Nesmith Lake Blvd
- 2710 Christensen Ave
- 2803 Nesmith Lake Blvd
- 2717 Christensen Ave
- 2683 Edwin Ave
- 2706 Christensen Ave