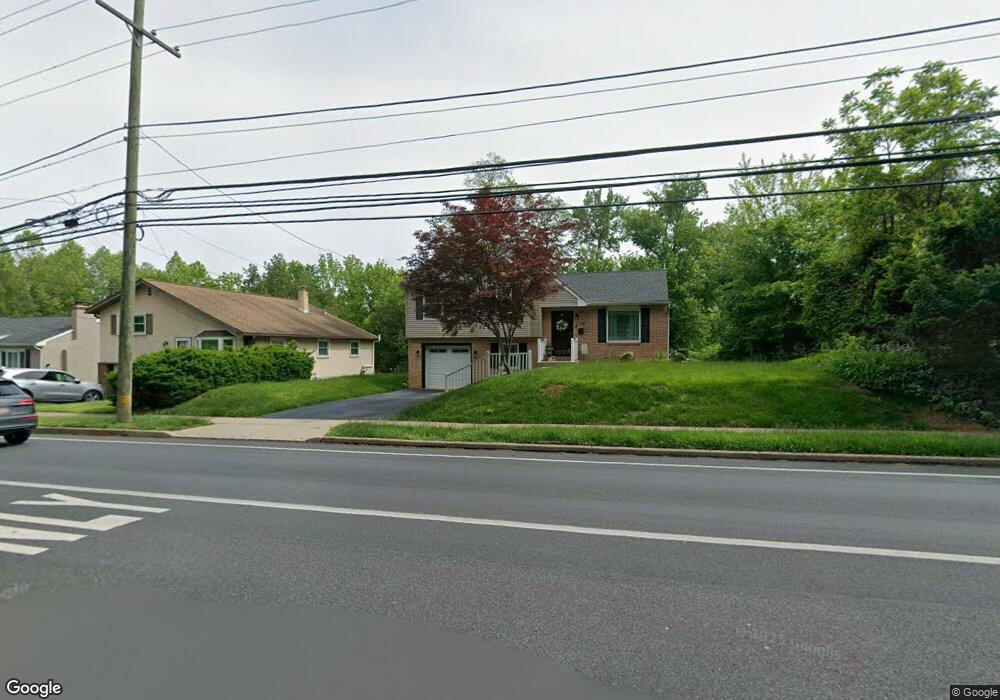
2769 Susquehanna Rd Abington, PA 19001
Estimated Value: $375,000 - $400,783
3
Beds
2
Baths
1,234
Sq Ft
$311/Sq Ft
Est. Value
About This Home
This home is located at 2769 Susquehanna Rd, Abington, PA 19001 and is currently estimated at $383,696, approximately $310 per square foot. 2769 Susquehanna Rd is a home located in Montgomery County with nearby schools including Roslyn School, Abington Middle School, and Abington Senior High School.
Ownership History
Date
Name
Owned For
Owner Type
Purchase Details
Closed on
Mar 29, 1996
Sold by
Sheppleman Paul and Sheppleman Debra
Bought by
Frye Janice E
Current Estimated Value
Create a Home Valuation Report for This Property
The Home Valuation Report is an in-depth analysis detailing your home's value as well as a comparison with similar homes in the area
Home Values in the Area
Average Home Value in this Area
Purchase History
| Date | Buyer | Sale Price | Title Company |
|---|---|---|---|
| Frye Janice E | $129,900 | -- |
Source: Public Records
Tax History Compared to Growth
Tax History
| Year | Tax Paid | Tax Assessment Tax Assessment Total Assessment is a certain percentage of the fair market value that is determined by local assessors to be the total taxable value of land and additions on the property. | Land | Improvement |
|---|---|---|---|---|
| 2025 | $5,520 | $119,200 | $38,860 | $80,340 |
| 2024 | $5,520 | $119,200 | $38,860 | $80,340 |
| 2023 | $5,290 | $119,200 | $38,860 | $80,340 |
| 2022 | $5,120 | $119,200 | $38,860 | $80,340 |
| 2021 | $4,845 | $119,200 | $38,860 | $80,340 |
| 2020 | $4,775 | $119,200 | $38,860 | $80,340 |
| 2019 | $4,775 | $119,200 | $38,860 | $80,340 |
| 2018 | $4,775 | $119,200 | $38,860 | $80,340 |
| 2017 | $4,635 | $119,200 | $38,860 | $80,340 |
| 2016 | $4,588 | $119,200 | $38,860 | $80,340 |
| 2015 | $4,313 | $119,200 | $38,860 | $80,340 |
| 2014 | $4,313 | $119,200 | $38,860 | $80,340 |
Source: Public Records
Map
Nearby Homes
- 2806 Anzac Ave
- 2750 Turner Ave
- 2653 Barnes Ave
- 2933 Susquehanna Rd
- 309 Woodside Cir
- 2637 Woodland Rd
- 1212 Duncan Dr
- 3012 Lincoln Ave
- 1403 Birchwood Ave
- 868 Tyson Ave
- 1503 Lindbergh Ave
- 3225 Burn Brae Dr
- 722 Maple Ave
- 743 Penn Ave
- 1155 Easton Rd
- 1422 High Ave
- 908 Edge Hill Rd
- 648 N Tyson Ave
- 1567 Lindbergh Ave
- 25 Northview Dr
- 2773 Susquehanna Rd
- 2765 Susquehanna Rd
- 2757 Susquehanna Rd
- 2776 Susquehanna Rd
- 2747 Susquehanna Rd
- 2804 Susquehanna Rd
- 1089 Maple Ave
- 1092 Maple Ave
- 2743 Susquehanna Rd
- 1088 Maple Ave
- 2737 Susquehanna Rd
- 1081 Maple Ave
- 2812 Susquehanna Rd
- 1079 Maple Ave
- 1082 Maple Ave
- 2731 Susquehanna Rd
- 1078 Maple Ave
- 1084 Maple Ave
- 1075 Maple Ave
- 1074 Maple Ave