Estimated Value: $457,000 - $488,000
5
Beds
3
Baths
2,059
Sq Ft
$228/Sq Ft
Est. Value
About This Home
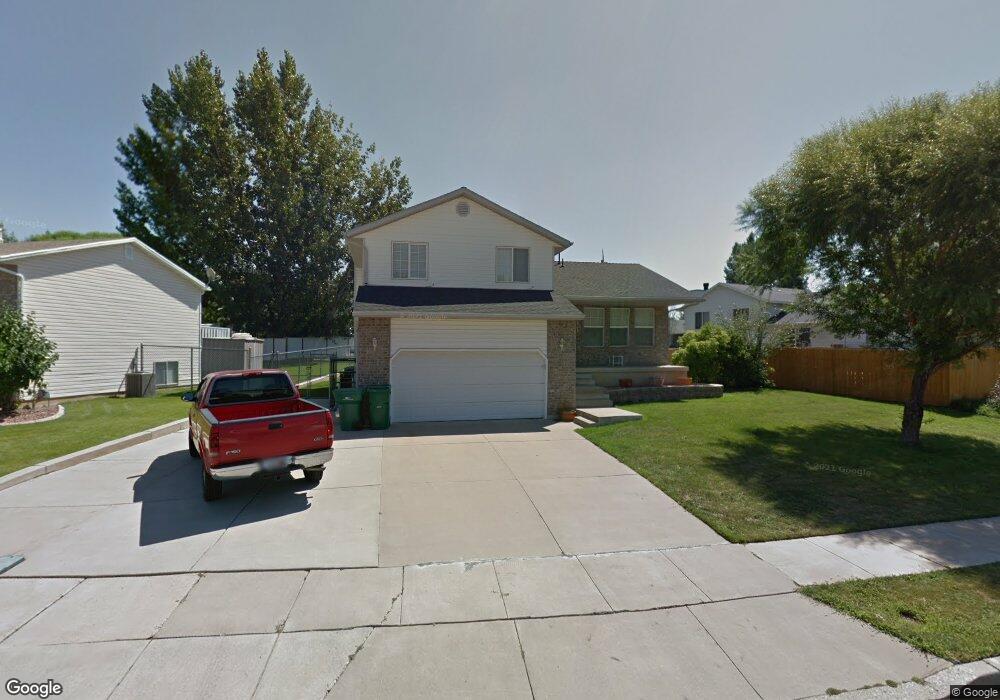
This home is located at 2769 W 4275 S, Roy, UT 84067 and is currently estimated at $468,450, approximately $227 per square foot. 2769 W 4275 S is a home located in Weber County with nearby schools including Midland School, Sand Ridge Junior High School, and Roy High School.
Ownership History
Date
Name
Owned For
Owner Type
Purchase Details
Closed on
May 10, 2016
Bought by
Hamblin Randall J
Current Estimated Value
Home Financials for this Owner
Home Financials are based on the most recent Mortgage that was taken out on this home.
Original Mortgage
$180,600
Outstanding Balance
$143,535
Interest Rate
3.61%
Estimated Equity
$324,915
Purchase Details
Closed on
Jun 30, 2008
Sold by
Oliver Stuart Ross and Oliver Tamilla L
Bought by
Hamblin Jennifer L and Hamblin Randy J
Home Financials for this Owner
Home Financials are based on the most recent Mortgage that was taken out on this home.
Original Mortgage
$186,473
Interest Rate
6%
Mortgage Type
Purchase Money Mortgage
Purchase Details
Closed on
Jan 25, 1999
Sold by
Oliver Tamilla L
Bought by
Oliver Stuart Ross and Oliver Tamilla L
Home Financials for this Owner
Home Financials are based on the most recent Mortgage that was taken out on this home.
Original Mortgage
$100,000
Interest Rate
6.29%
Create a Home Valuation Report for This Property
The Home Valuation Report is an in-depth analysis detailing your home's value as well as a comparison with similar homes in the area
Home Values in the Area
Average Home Value in this Area
Purchase History
| Date | Buyer | Sale Price | Title Company |
|---|---|---|---|
| Hamblin Randall J | -- | -- | |
| Hamblin Jennifer L | -- | Mountain View Title Ogden | |
| Oliver Stuart Ross | -- | Mountain View Title |
Source: Public Records
Mortgage History
| Date | Status | Borrower | Loan Amount |
|---|---|---|---|
| Open | Hamblin Randall J | $180,600 | |
| Closed | Hamblin Randall J | -- | |
| Previous Owner | Hamblin Jennifer L | $186,473 | |
| Previous Owner | Oliver Stuart Ross | $100,000 |
Source: Public Records
Tax History
| Year | Tax Paid | Tax Assessment Tax Assessment Total Assessment is a certain percentage of the fair market value that is determined by local assessors to be the total taxable value of land and additions on the property. | Land | Improvement |
|---|---|---|---|---|
| 2025 | $2,761 | $440,223 | $131,101 | $309,122 |
| 2024 | $2,639 | $232,649 | $72,105 | $160,544 |
| 2023 | $2,487 | $218,900 | $70,326 | $148,574 |
| 2022 | $2,809 | $257,400 | $59,551 | $197,849 |
| 2021 | $2,197 | $329,000 | $73,276 | $255,724 |
| 2020 | $2,132 | $294,000 | $73,276 | $220,724 |
| 2019 | $2,058 | $267,000 | $48,484 | $218,516 |
| 2018 | $1,884 | $229,000 | $43,596 | $185,404 |
| 2017 | $1,737 | $197,000 | $41,653 | $155,347 |
| 2016 | $1,700 | $103,834 | $24,255 | $79,579 |
| 2015 | $1,531 | $95,211 | $24,255 | $70,956 |
| 2014 | $1,499 | $92,029 | $21,415 | $70,614 |
Source: Public Records
Map
Nearby Homes
- 4297 Westlake Dr
- 2815 W 4275 S
- 4374 S 2900 W
- 2778 W 4175 S Unit 237
- 4270 S 2900 W
- 2979 W 4275 S
- 4248 S 2400 W
- 2953 W 4650 S
- 4732 S West Park Dr
- 3931 S 2950 W
- 3860 S Midland Dr Unit B 51
- 3022 W 4750 S
- 4793 S 3025 W
- 4328 S 2175 W
- 4891 S 2875 W
- 4061 S 2175 W
- 3114 S 3175 W Unit 21
- 3750 S Midland Dr Unit 80
- 3750 S Midland Dr Unit 189
- 3750 S Midland Dr
Your Personal Tour Guide
Ask me questions while you tour the home.