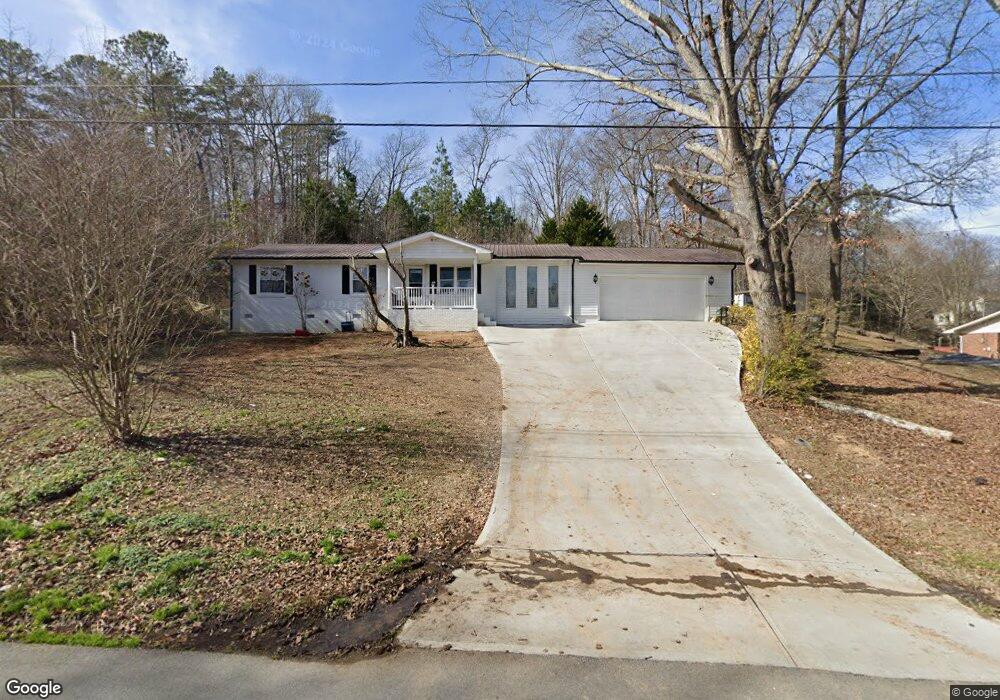
277 Beamer Cir SW Calhoun, GA 30701
Estimated Value: $259,000 - $303,779
3
Beds
2
Baths
1,752
Sq Ft
$160/Sq Ft
Est. Value
About This Home
This home is located at 277 Beamer Cir SW, Calhoun, GA 30701 and is currently estimated at $280,195, approximately $159 per square foot. 277 Beamer Cir SW is a home located in Gordon County with nearby schools including Swain Elementary School, Ashworth Middle School, and Gordon Central High School.
Ownership History
Date
Name
Owned For
Owner Type
Purchase Details
Closed on
May 19, 2023
Sold by
Greystone Housing Llc
Bought by
Choctaw American Insurance Inc
Current Estimated Value
Home Financials for this Owner
Home Financials are based on the most recent Mortgage that was taken out on this home.
Original Mortgage
$2,800
Outstanding Balance
$2,296
Interest Rate
6.39%
Mortgage Type
New Conventional
Estimated Equity
$277,899
Purchase Details
Closed on
Mar 4, 2011
Sold by
Bradford William E and Bradford Julia A
Bought by
Hopkins Terry
Purchase Details
Closed on
Jul 2, 2010
Sold by
Bradford William
Bought by
Bradford William E and Bradford Julia A
Purchase Details
Closed on
Nov 14, 2000
Sold by
Bradford William E
Bought by
Bradford William E
Purchase Details
Closed on
Sep 6, 1995
Bought by
Bradford William E
Purchase Details
Closed on
Jul 1, 1992
Bought by
Harvey Julia A
Create a Home Valuation Report for This Property
The Home Valuation Report is an in-depth analysis detailing your home's value as well as a comparison with similar homes in the area
Home Values in the Area
Average Home Value in this Area
Purchase History
| Date | Buyer | Sale Price | Title Company |
|---|---|---|---|
| Choctaw American Insurance Inc | $280,000 | -- | |
| Hopkins Terry | $112,300 | -- | |
| Bradford William E | -- | -- | |
| Bradford William E | -- | -- | |
| Bradford William E | $56,000 | -- | |
| Harvey Julia A | $53,900 | -- |
Source: Public Records
Mortgage History
| Date | Status | Borrower | Loan Amount |
|---|---|---|---|
| Open | Choctaw American Insurance Inc | $2,800 | |
| Open | Choctaw American Insurance Inc | $274,928 |
Source: Public Records
Tax History Compared to Growth
Tax History
| Year | Tax Paid | Tax Assessment Tax Assessment Total Assessment is a certain percentage of the fair market value that is determined by local assessors to be the total taxable value of land and additions on the property. | Land | Improvement |
|---|---|---|---|---|
| 2024 | $2,187 | $86,080 | $3,360 | $82,720 |
| 2023 | $1,431 | $56,320 | $3,360 | $52,960 |
| 2022 | $1,349 | $51,920 | $2,320 | $49,600 |
| 2021 | $1,156 | $43,280 | $2,320 | $40,960 |
| 2020 | $1,201 | $43,920 | $2,320 | $41,600 |
| 2019 | $1,234 | $44,840 | $2,320 | $42,520 |
| 2018 | $1,161 | $42,320 | $2,320 | $40,000 |
| 2017 | $1,130 | $40,120 | $2,320 | $37,800 |
| 2016 | $1,132 | $40,120 | $2,320 | $37,800 |
| 2015 | $1,107 | $38,920 | $2,320 | $36,600 |
| 2014 | $1,036 | $37,582 | $2,352 | $35,230 |
Source: Public Records
Map
Nearby Homes
- 130 Brookstone Dr SW
- 176 Village Way SW
- 137 Regency Row SW
- 413 Beamer Rd SW
- The Braselton II Plan at Fair Oak
- The Reynolds Plan at Fair Oak
- The Buford II Plan at Fair Oak
- The Lawson Plan at Fair Oak
- The Caldwell Plan at Fair Oak
- The Benson II Plan at Fair Oak
- The Greenbrier II Plan at Fair Oak
- 210 Madison Dr SW
- 121 Foxhall Dr SW
- 0 Highway 53 Spur SW Unit 7529096
- 215 Wilson St
- 227 Mcconnell Rd
- 100 Neal St
- 00 Belmont Dr
- 404 Mcginnis Cir
- 0 Reeves Station Rd SW Unit 10548197
- 277 Beamer Cir SW
- 297 Beamer Cir SW
- 108 Overland Dr SW
- 282 Beamer Cir SW
- 262 Beamer Cir SW
- 140 Overland Dr SW
- 298 Beamer Cir SW
- 150 Overland Dr SW
- 104 Overland Dr SW
- 164 Overland Dr SW
- 319 Beamer Cir SW
- 131 Overland Dr SW
- 470 Lakecrest Cir SW
- 464 Lakecrest Cir SW
- 113 Westview Dr SW
- 434 Lakecrest Cir SW
- 207 Patriots Row SW
- 478 Lakecrest Cir SW
- 131 Westview Dr SW
- 119 Westview Dr SW