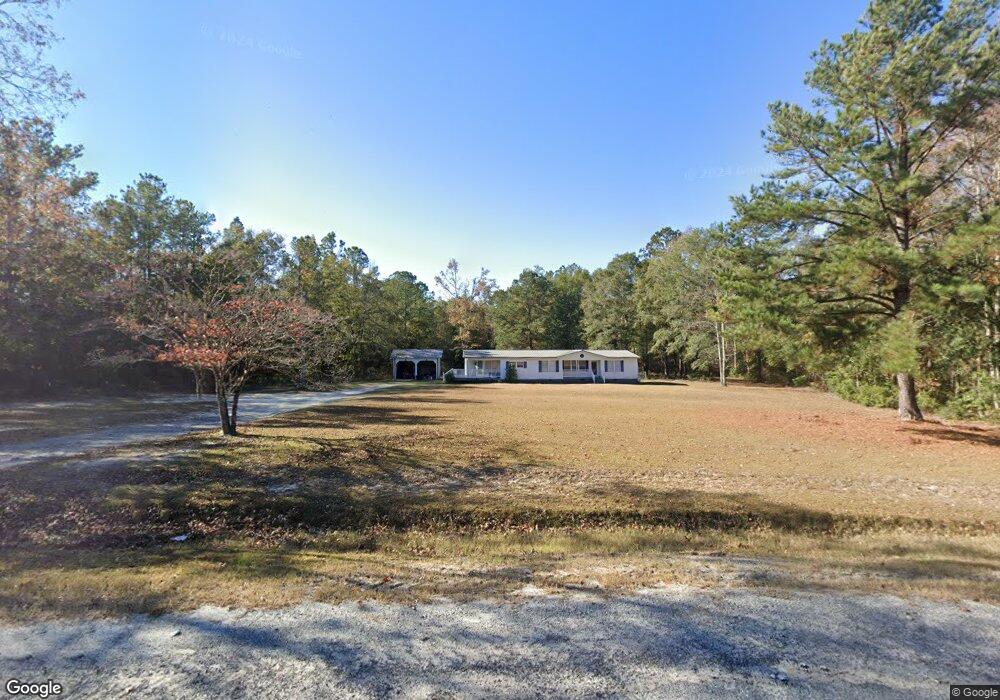
277 Log Landing Cir Springfield, GA 31329
Estimated Value: $285,000 - $337,438
3
Beds
2
Baths
1,661
Sq Ft
$187/Sq Ft
Est. Value
About This Home
This home is located at 277 Log Landing Cir, Springfield, GA 31329 and is currently estimated at $310,610, approximately $187 per square foot. 277 Log Landing Cir is a home located in Effingham County with nearby schools including Ebenezer Elementary School, Effingham County Middle School, and Effingham County High School.
Ownership History
Date
Name
Owned For
Owner Type
Purchase Details
Closed on
Sep 15, 2022
Sold by
Saad Ashley N
Bought by
Saad Jason T
Current Estimated Value
Purchase Details
Closed on
Sep 17, 2021
Sold by
Stone Layton M
Bought by
Saad Jason T and Saad Ashley N
Home Financials for this Owner
Home Financials are based on the most recent Mortgage that was taken out on this home.
Original Mortgage
$219,945
Interest Rate
2.8%
Mortgage Type
VA
Purchase Details
Closed on
Jul 22, 2019
Sold by
Miles Daniel R
Bought by
Stone Layton M and Edwards Morgan
Home Financials for this Owner
Home Financials are based on the most recent Mortgage that was taken out on this home.
Original Mortgage
$157,102
Interest Rate
4.12%
Mortgage Type
FHA
Purchase Details
Closed on
Apr 11, 2002
Bought by
Miles Daniel R
Create a Home Valuation Report for This Property
The Home Valuation Report is an in-depth analysis detailing your home's value as well as a comparison with similar homes in the area
Home Values in the Area
Average Home Value in this Area
Purchase History
| Date | Buyer | Sale Price | Title Company |
|---|---|---|---|
| Saad Jason T | -- | -- | |
| Saad Jason T | $215,000 | -- | |
| Stone Layton M | $160,000 | -- | |
| Miles Daniel R | $76,700 | -- |
Source: Public Records
Mortgage History
| Date | Status | Borrower | Loan Amount |
|---|---|---|---|
| Previous Owner | Saad Jason T | $219,945 | |
| Previous Owner | Stone Layton M | $157,102 |
Source: Public Records
Tax History Compared to Growth
Tax History
| Year | Tax Paid | Tax Assessment Tax Assessment Total Assessment is a certain percentage of the fair market value that is determined by local assessors to be the total taxable value of land and additions on the property. | Land | Improvement |
|---|---|---|---|---|
| 2025 | $518 | $136,300 | $60,639 | $75,661 |
| 2024 | $518 | $112,858 | $46,541 | $66,317 |
| 2023 | $396 | $100,416 | $46,541 | $53,876 |
| 2022 | $380 | $86,560 | $32,684 | $53,876 |
| 2021 | $2,088 | $63,332 | $30,834 | $32,498 |
| 2020 | $1,621 | $47,987 | $17,873 | $30,114 |
| 2019 | $1,580 | $46,364 | $16,250 | $30,114 |
| 2018 | $1,574 | $45,759 | $17,733 | $28,026 |
| 2017 | $1,583 | $45,759 | $17,733 | $28,026 |
| 2016 | $1,505 | $45,293 | $17,733 | $27,560 |
| 2015 | -- | $45,293 | $17,733 | $27,560 |
| 2014 | -- | $45,057 | $17,733 | $27,324 |
| 2013 | -- | $45,057 | $17,732 | $27,324 |
Source: Public Records
Map
Nearby Homes
- 695 Log Landing Rd
- 103 Mingledorff Way
- 548 Log Landing Rd
- 448 Shadowbrook Cir
- 101 Black Pine Dr
- 90 Mossy Oak Dr
- 119 Blackwater Way
- 106 Blackwater Way
- 109 Knotty Pine Cir
- 100 Pine Thicket Way
- 0 Beebe Rd Unit 13221171
- 429 Ralph Rahn Rd
- 379 Beebe Rd
- 202 Stag Rd
- 213 Doe Cir
- 0 S Laurel St Unit 314048
- 124 Old Stillwell Rd
- 247 Lillian St
- 306 Lillian St
- 0 Stillwell Clyo Rd Unit SA340237
- 0 Log Landing Cir Unit Lot 20 317230
- 225 Log Landing Cir
- 270 Log Landing Cir
- 185 Log Landing Cir
- 187 Log Landing Cir
- 339 Log Landing Cir
- 250 Log Landing Cir
- 310 Log Landing Cir
- 499 Log Landing Cir
- 201 Log Landing Dr
- 184 Log Landing Dr
- 121 Log Landing Cir
- 757 Log Landing Rd
- 160 Log Landing Dr
- 145 Log Landing Dr
- 219 Hickory Cir
- 119 Overstreet Way
- 103 Inez Ave
- 102 Overstreet
- 271 Hickory Cir