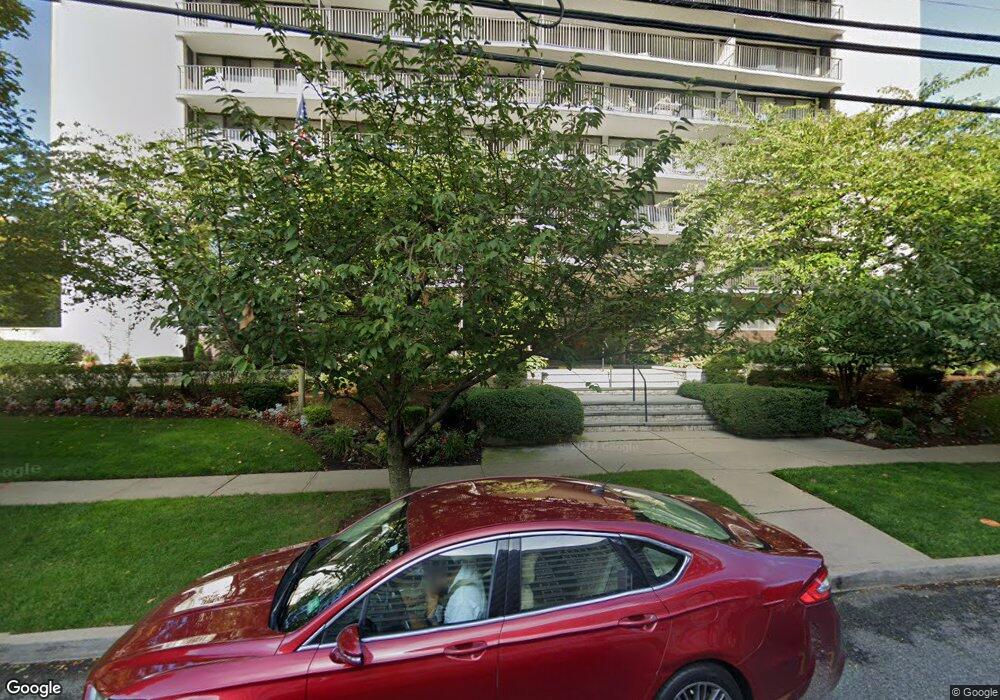
The Bristol House Condominiums 277 Prospect Ave Hackensack, NJ 07601
Estimated Value: $285,000 - $289,270
--
Bed
--
Bath
922
Sq Ft
$312/Sq Ft
Est. Value
About This Home
This home is located at 277 Prospect Ave, Hackensack, NJ 07601 and is currently estimated at $287,757, approximately $312 per square foot. 277 Prospect Ave is a home located in Bergen County with nearby schools including Hackensack High School and Bergen County Christian Academy.
Ownership History
Date
Name
Owned For
Owner Type
Purchase Details
Closed on
Jun 30, 2016
Sold by
Pav Ventures Incorporated
Bought by
Msw Prospect Lc
Current Estimated Value
Purchase Details
Closed on
Dec 30, 2015
Sold by
Us Bank National Association
Bought by
Pav Ventures Llc
Purchase Details
Closed on
Nov 24, 2014
Sold by
Saudino Michael and Arango Liliana
Bought by
Us Bank Na and Bank Of America Na
Purchase Details
Closed on
Sep 27, 2005
Sold by
Kyser Michael
Bought by
Arango Lilian
Home Financials for this Owner
Home Financials are based on the most recent Mortgage that was taken out on this home.
Original Mortgage
$216,000
Interest Rate
5.79%
Purchase Details
Closed on
Mar 22, 2002
Sold by
Gill Lisa Prunty
Bought by
Kyser Michael
Home Financials for this Owner
Home Financials are based on the most recent Mortgage that was taken out on this home.
Original Mortgage
$121,500
Interest Rate
6.85%
Purchase Details
Closed on
Jul 28, 1998
Sold by
Crawford Hill Patricia E and Crawford Patricia E
Bought by
Prunty Lisa A
Create a Home Valuation Report for This Property
The Home Valuation Report is an in-depth analysis detailing your home's value as well as a comparison with similar homes in the area
Home Values in the Area
Average Home Value in this Area
Purchase History
| Date | Buyer | Sale Price | Title Company |
|---|---|---|---|
| Msw Prospect Lc | $140,000 | Chicago Title Insurance Comp | |
| Pav Ventures Llc | $94,500 | Stewart Title | |
| Us Bank Na | -- | None Available | |
| Arango Lilian | $270,000 | -- | |
| Kyser Michael | $135,000 | -- | |
| Prunty Lisa A | $82,000 | -- |
Source: Public Records
Mortgage History
| Date | Status | Borrower | Loan Amount |
|---|---|---|---|
| Previous Owner | Arango Lilian | $216,000 | |
| Previous Owner | Kyser Michael | $121,500 |
Source: Public Records
Tax History Compared to Growth
Tax History
| Year | Tax Paid | Tax Assessment Tax Assessment Total Assessment is a certain percentage of the fair market value that is determined by local assessors to be the total taxable value of land and additions on the property. | Land | Improvement |
|---|---|---|---|---|
| 2025 | $5,693 | $186,300 | $90,000 | $96,300 |
| 2024 | $5,364 | $186,300 | $90,000 | $96,300 |
| 2023 | $5,100 | $186,300 | $90,000 | $96,300 |
| 2022 | $5,100 | $182,000 | $85,500 | $96,500 |
| 2021 | $5,709 | $170,000 | $81,500 | $88,500 |
| 2020 | $5,625 | $170,000 | $81,500 | $88,500 |
| 2019 | $5,636 | $167,900 | $80,100 | $87,800 |
| 2018 | $5,058 | $148,200 | $77,900 | $70,300 |
| 2017 | $4,993 | $146,200 | $76,500 | $69,700 |
| 2016 | $5,780 | $171,100 | $95,000 | $76,100 |
| 2015 | $7,840 | $224,000 | $73,900 | $150,100 |
| 2014 | $7,441 | $224,000 | $73,900 | $150,100 |
Source: Public Records
About The Bristol House Condominiums
Map
Nearby Homes
- 277 Prospect Ave Unit 4H
- 277 Prospect Ave Unit 8D
- 245 Prospect Ave Unit PHB
- 245 Prospect Ave Unit 5B
- 307 Prospect Ave Unit 9a
- 307 Prospect Ave Unit 16A
- 307 Prospect Ave Unit 18C
- 307 Prospect Ave Unit 4 G
- 280 Prospect Ave Unit 5F
- 280 Prospect Ave Unit 3N
- 316 Prospect Ave Unit 8D
- 316 Prospect Ave Unit 6F
- 316 Prospect Ave Unit 3C
- 316 Prospect Ave Unit 9E
- 316 Prospect Ave Unit 4B
- 316 Prospect Ave Unit 4E
- 326 Prospect Ave Unit 12B
- 326 Prospect Ave Unit 11A
- 326 Prospect Ave Unit 5H
- 326 Prospect Ave Unit 12H
- 277 Prospect Ave Unit 1f
- 277 Prospect Ave Unit 16a
- 277 Prospect Ave Unit 16H
- 277 Prospect Ave Unit 16C
- 277 Prospect Ave
- 277 Prospect Ave
- 277 Prospect Ave
- 277 Prospect Ave
- 277 Prospect Ave Unit C008D
- 277 Prospect Ave Unit C002C
- 277 Prospect Ave
- 277 Prospect Ave
- 277 Prospect Ave
- 277 Prospect Ave
- 277 Prospect Ave
- 277 Prospect Ave
- 277 Prospect Ave
- 277 Prospect Ave
- 277 Prospect Ave
- 277 Prospect Ave Unit 18G