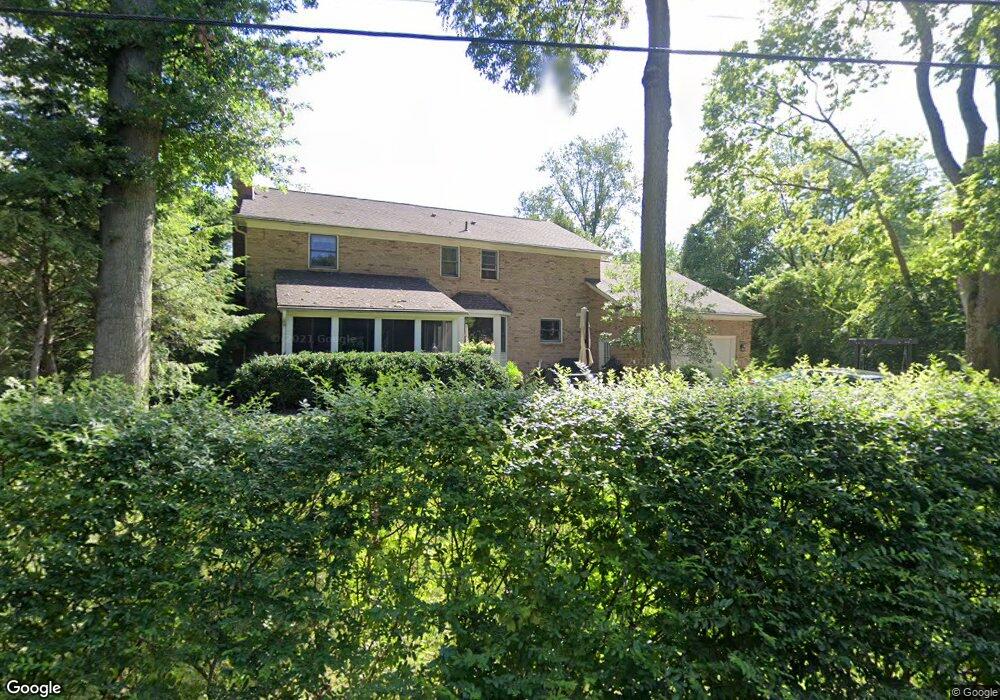
277 S Parkview Ave Columbus, OH 43209
Estimated Value: $1,086,351 - $1,290,000
5
Beds
3
Baths
3,110
Sq Ft
$392/Sq Ft
Est. Value
About This Home
This home is located at 277 S Parkview Ave, Columbus, OH 43209 and is currently estimated at $1,219,588, approximately $392 per square foot. 277 S Parkview Ave is a home located in Franklin County with nearby schools including Cassingham Elementary School, Bexley Middle School, and Bexley High School.
Ownership History
Date
Name
Owned For
Owner Type
Purchase Details
Closed on
Jun 11, 2009
Sold by
Wright William and Trust Of William Wright
Bought by
Carmon Christopher A and Carmon Toni R
Current Estimated Value
Home Financials for this Owner
Home Financials are based on the most recent Mortgage that was taken out on this home.
Original Mortgage
$419,000
Outstanding Balance
$281,656
Interest Rate
5.99%
Mortgage Type
Purchase Money Mortgage
Estimated Equity
$937,932
Purchase Details
Closed on
Sep 24, 2007
Sold by
Wright William and Wright Natalie B
Bought by
Wright William and Declaration Of Trust Of Willia
Purchase Details
Closed on
Dec 1, 1977
Bought by
Wright William
Purchase Details
Closed on
Aug 7, 1977
Bought by
Wright William
Create a Home Valuation Report for This Property
The Home Valuation Report is an in-depth analysis detailing your home's value as well as a comparison with similar homes in the area
Home Values in the Area
Average Home Value in this Area
Purchase History
| Date | Buyer | Sale Price | Title Company |
|---|---|---|---|
| Carmon Christopher A | $475,000 | Hummel Titl | |
| Wright William | -- | Attorney | |
| Wright William | $150,500 | -- | |
| Wright William | -- | -- |
Source: Public Records
Mortgage History
| Date | Status | Borrower | Loan Amount |
|---|---|---|---|
| Open | Carmon Christopher A | $419,000 |
Source: Public Records
Tax History Compared to Growth
Tax History
| Year | Tax Paid | Tax Assessment Tax Assessment Total Assessment is a certain percentage of the fair market value that is determined by local assessors to be the total taxable value of land and additions on the property. | Land | Improvement |
|---|---|---|---|---|
| 2024 | $18,101 | $325,960 | $120,750 | $205,210 |
| 2023 | $16,275 | $325,960 | $120,750 | $205,210 |
| 2022 | $13,626 | $219,180 | $61,710 | $157,470 |
| 2021 | $13,637 | $219,180 | $61,710 | $157,470 |
| 2020 | $13,517 | $219,180 | $61,710 | $157,470 |
| 2019 | $13,918 | $198,560 | $56,070 | $142,490 |
| 2018 | $12,485 | $198,560 | $56,070 | $142,490 |
| 2017 | $12,321 | $198,560 | $56,070 | $142,490 |
| 2016 | $12,840 | $197,400 | $60,270 | $137,130 |
| 2015 | $12,878 | $197,400 | $60,270 | $137,130 |
| 2014 | $12,951 | $197,400 | $60,270 | $137,130 |
| 2013 | $6,120 | $179,445 | $54,775 | $124,670 |
Source: Public Records
Map
Nearby Homes
- 211 Preston Rd
- 419 Westland Ave
- 57 Preston Rd
- 1833 Franklin Ave
- 2430 Plymouth Ave
- 2350 Bryden Rd
- 2455 Dale Ave
- 1825-1827 Bryden Rd
- 268 S Cassady Ave
- 2425 Bryden Rd
- 1714 Oak St
- 1000 S Dawson Ave Unit 302
- 1779 E Main St
- 1692 Bryden Rd
- 1669-1671 Oak St
- 395-397 Stoddart Ave
- 572 Bulen Ave
- 1800 E Fulton St
- 1747 E Mound St
- 1596 Franklin Ave Unit 598
- 275 S Parkview Ave
- 281 S Parkview Ave
- 295 S Parkview Ave
- 271 S Parkview Ave
- 265 S Parkview Ave
- 266 Preston Rd
- 2123 Fair Ave
- 252 Preston Rd
- 311 S Parkview Ave
- 240 Preston Rd
- 261 S Parkview Ave
- 325 S Parkview Ave
- 311 Westland Ave
- 280 S Parkview Ave
- 228 Preston Rd
- 0 S Parkview Ave
- 299 Preston Rd
- 295 Preston Rd
- 300 S Parkview Ave
- 291 Preston Rd