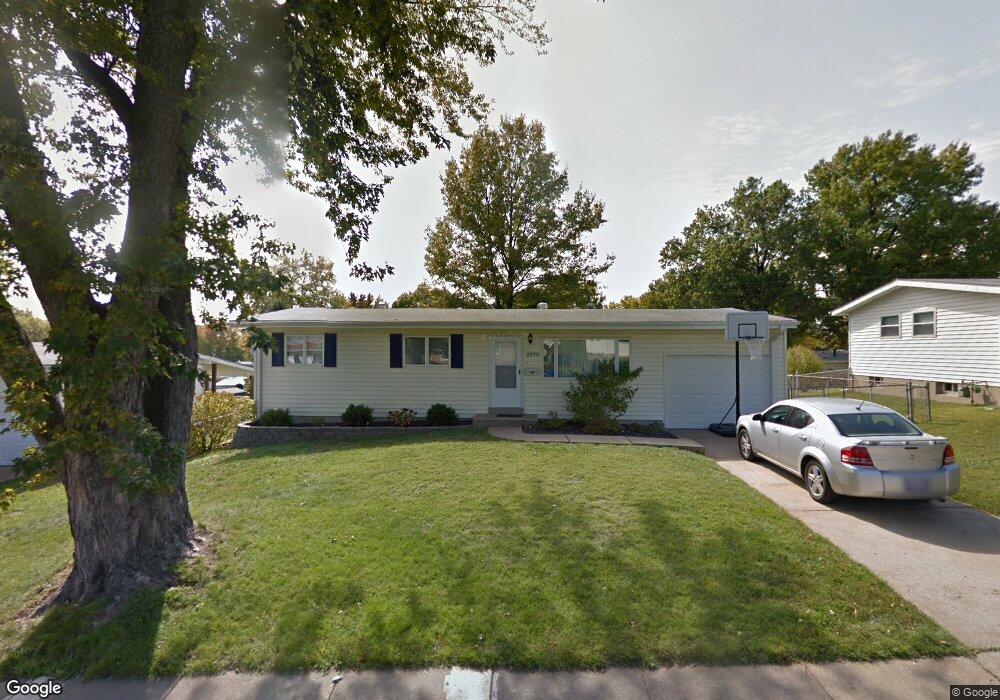
2770 Dove Dr Florissant, MO 63031
Estimated Value: $107,000 - $183,000
3
Beds
1
Bath
1,025
Sq Ft
$153/Sq Ft
Est. Value
About This Home
This home is located at 2770 Dove Dr, Florissant, MO 63031 and is currently estimated at $156,646, approximately $152 per square foot. 2770 Dove Dr is a home located in St. Louis County with nearby schools including Lusher Elementary School, Northwest Middle School, and Hazelwood West High School.
Ownership History
Date
Name
Owned For
Owner Type
Purchase Details
Closed on
Jul 21, 2025
Sold by
Mccameron Samantha E
Bought by
Zoom 2021R1 Llc
Current Estimated Value
Home Financials for this Owner
Home Financials are based on the most recent Mortgage that was taken out on this home.
Original Mortgage
$132,100
Outstanding Balance
$131,876
Interest Rate
6.84%
Mortgage Type
Construction
Estimated Equity
$24,770
Purchase Details
Closed on
Apr 4, 2013
Sold by
Deeken Matthew M and Deeken Emily
Bought by
Mccameron Samantha E
Home Financials for this Owner
Home Financials are based on the most recent Mortgage that was taken out on this home.
Original Mortgage
$87,289
Interest Rate
4.4%
Mortgage Type
FHA
Purchase Details
Closed on
Sep 26, 2001
Sold by
Herpers Cesar E and Herpers Patricia T
Bought by
Deeken Matthew M
Home Financials for this Owner
Home Financials are based on the most recent Mortgage that was taken out on this home.
Original Mortgage
$87,203
Interest Rate
6.88%
Create a Home Valuation Report for This Property
The Home Valuation Report is an in-depth analysis detailing your home's value as well as a comparison with similar homes in the area
Home Values in the Area
Average Home Value in this Area
Purchase History
| Date | Buyer | Sale Price | Title Company |
|---|---|---|---|
| Zoom 2021R1 Llc | -- | Freedom Title | |
| Mccameron Samantha E | $88,900 | Investors Title Co Clayton | |
| Deeken Matthew M | $89,900 | -- |
Source: Public Records
Mortgage History
| Date | Status | Borrower | Loan Amount |
|---|---|---|---|
| Open | Zoom 2021R1 Llc | $132,100 | |
| Previous Owner | Mccameron Samantha E | $87,289 | |
| Previous Owner | Deeken Matthew M | $87,203 |
Source: Public Records
Tax History Compared to Growth
Tax History
| Year | Tax Paid | Tax Assessment Tax Assessment Total Assessment is a certain percentage of the fair market value that is determined by local assessors to be the total taxable value of land and additions on the property. | Land | Improvement |
|---|---|---|---|---|
| 2025 | $2,151 | $27,670 | $5,780 | $21,890 |
| 2024 | $2,151 | $23,960 | $3,310 | $20,650 |
| 2023 | $2,151 | $23,960 | $3,310 | $20,650 |
| 2022 | $2,102 | $20,920 | $4,290 | $16,630 |
| 2021 | $2,047 | $20,920 | $4,290 | $16,630 |
| 2020 | $1,854 | $17,810 | $3,310 | $14,500 |
| 2019 | $1,826 | $17,810 | $3,310 | $14,500 |
| 2018 | $1,632 | $14,610 | $2,510 | $12,100 |
| 2017 | $1,630 | $14,610 | $2,510 | $12,100 |
| 2016 | $1,656 | $14,650 | $2,890 | $11,760 |
| 2015 | $1,621 | $14,650 | $2,890 | $11,760 |
| 2014 | $1,774 | $16,550 | $3,910 | $12,640 |
Source: Public Records
Map
Nearby Homes
- 1767 Stilton Ct
- 1834 Night Dr
- 2216 Foggy Bottom Dr
- 2171 Farthing Ct
- 2347 Farflung Dr
- 2 Meadows
- 2 Berwick at River Bluffs Manors
- 2 Ashford at River Bluffs Manors
- 2 Meadows
- 2 Maple at River Bluffs Manors
- 2490 Mullanphy Ln
- 2 Royal II at River Bluffs Manors
- 2 Aspen II at River Bluffs Manors
- 2 Sterling at River Bluffs Manors
- 2334 White Ash Ct
- 2314 White Ash Ct
- 2 Fieldcrest at River Bluffs Meadows
- 2 Aspen at River Bluffs Manors Unit Aspen at River Bluff
- 2 Belmont at River Bluffs Meadows
- 2145 Flamingo Dr
- 2750 Dove Dr
- 2780 Dove Dr
- 2755 Mockingbird Ln
- 2745 Mockingbird Ln
- 2775 Mockingbird Ln
- 2730 Dove Dr
- 1570 Bluff Dr
- 2725 Mockingbird Ln
- 2755 Dove Dr
- 2775 Dove Dr
- 1550 Bluff Dr
- 2745 Dove Dr
- 2710 Dove Dr
- 1590 Bluff Dr
- 2715 Mockingbird Ln
- 2725 Dove Dr
- 2770 Mockingbird Ln
- 2750 Mockingbird Ln
- 2780 Mockingbird Ln
- 2705 Mockingbird Ln