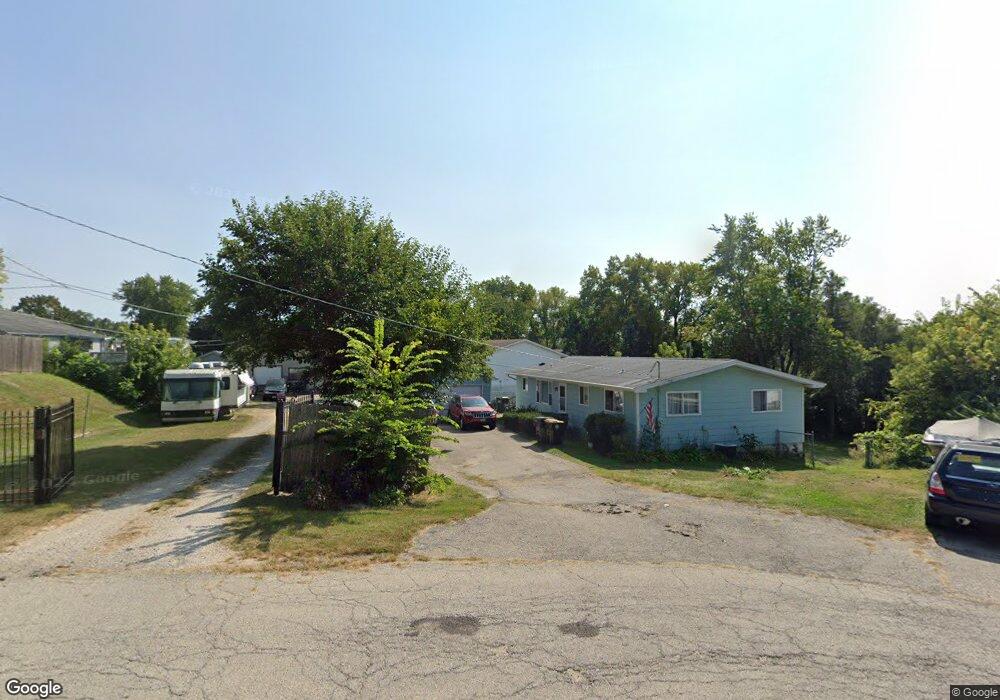
27701 W North Ct Ingleside, IL 60041
East Palm Beach NeighborhoodEstimated Value: $255,000 - $332,000
5
Beds
2
Baths
1,104
Sq Ft
$276/Sq Ft
Est. Value
About This Home
This home is located at 27701 W North Ct, Ingleside, IL 60041 and is currently estimated at $304,396, approximately $275 per square foot. 27701 W North Ct is a home located in Lake County with nearby schools including Big Hollow Primary School, Big Hollow Elementary School, and Big Hollow Middle School.
Ownership History
Date
Name
Owned For
Owner Type
Purchase Details
Closed on
Feb 13, 2008
Sold by
Mccray Gene L and Mccray Marsha J
Bought by
Dell Brian
Current Estimated Value
Home Financials for this Owner
Home Financials are based on the most recent Mortgage that was taken out on this home.
Original Mortgage
$153,250
Outstanding Balance
$95,854
Interest Rate
5.9%
Mortgage Type
Purchase Money Mortgage
Estimated Equity
$208,542
Purchase Details
Closed on
Oct 12, 2001
Sold by
Chomiak Jerzy and Chomiak Krystyna
Bought by
Mccray Gene L and Mccray Marsha J
Home Financials for this Owner
Home Financials are based on the most recent Mortgage that was taken out on this home.
Original Mortgage
$101,000
Interest Rate
6.6%
Purchase Details
Closed on
Jun 3, 2001
Sold by
Mccray Gene L and Mccray Marsha J
Bought by
Mccray Gene L and Mccray Marsha J
Create a Home Valuation Report for This Property
The Home Valuation Report is an in-depth analysis detailing your home's value as well as a comparison with similar homes in the area
Home Values in the Area
Average Home Value in this Area
Purchase History
| Date | Buyer | Sale Price | Title Company |
|---|---|---|---|
| Dell Brian | $161,500 | None Available | |
| Mccray Gene L | $199,000 | Lawyers Title Pick Up | |
| Mccray Gene L | -- | -- |
Source: Public Records
Mortgage History
| Date | Status | Borrower | Loan Amount |
|---|---|---|---|
| Open | Dell Brian | $153,250 | |
| Previous Owner | Mccray Gene L | $101,000 |
Source: Public Records
Tax History Compared to Growth
Tax History
| Year | Tax Paid | Tax Assessment Tax Assessment Total Assessment is a certain percentage of the fair market value that is determined by local assessors to be the total taxable value of land and additions on the property. | Land | Improvement |
|---|---|---|---|---|
| 2024 | $5,146 | $90,712 | $21,462 | $69,250 |
| 2023 | $5,526 | $78,041 | $20,219 | $57,822 |
| 2022 | $5,526 | $71,286 | $12,759 | $58,527 |
| 2021 | $5,417 | $67,194 | $12,027 | $55,167 |
| 2020 | $5,396 | $66,234 | $11,855 | $54,379 |
| 2019 | $5,199 | $63,515 | $11,368 | $52,147 |
| 2018 | $5,750 | $70,455 | $18,575 | $51,880 |
| 2017 | $5,603 | $65,122 | $17,169 | $47,953 |
| 2016 | $5,668 | $59,559 | $15,702 | $43,857 |
| 2015 | $5,451 | $55,580 | $14,653 | $40,927 |
| 2014 | $4,853 | $50,911 | $16,231 | $34,680 |
| 2012 | $4,565 | $53,049 | $16,913 | $36,136 |
Source: Public Records
Map
Nearby Homes
- 35403 N 2nd Ave
- 649 Windsor Dr Unit 3D
- 616 Windsor Dr Unit D
- 994 Reserve Ct
- 1370 U S 12
- 576 Windsor Dr Unit 370
- 35242 N Moody St
- 541 Foxridge Dr Unit 13D
- 34785 N Gogol Ave
- 26931 W Marion Ct
- 603 Illinois Route 59
- 532 Circle Dr
- 35100 N Indian Trail
- 545 Blue Springs Dr
- 411 Kings Rd
- 35116 N Lake Matthews Trail
- 27254 W Nippersink Rd
- 642 Key Largo Dr Unit 82
- 34966 N Forest Ave
- 26681 W Wooster Lake Dr
- 27703 W North Ct
- 27704 W South Ct
- 27705 W North Ct
- 27708 W South Ct
- 35146 N Hilldale Dr
- 35130 N Hilldale Dr
- 27685 W North Ct
- 35137 N Sheridan Dr
- 35161 N Sheridan Dr
- 27708 W North Ct
- 35167 N Sheridan Dr
- 35127 N Sheridan Dr
- 35118 N Hilldale Dr
- 35183 N Sheridan Dr
- 27705 W South Ct
- 35121 N Sheridan Dr
- 27704 W North Ct
- 35200 N Hilldale Dr
- 35101 N Sheridan Dr
- 27703 W South Ct