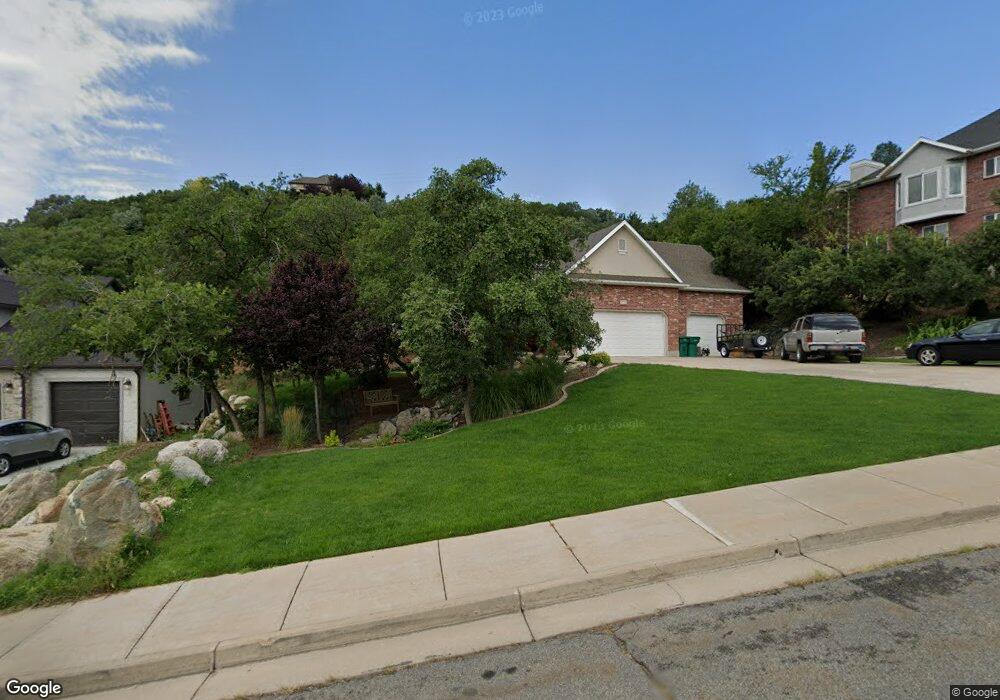
2771 N 2125 E Layton, UT 84040
Estimated Value: $752,000 - $836,000
5
Beds
3
Baths
4,244
Sq Ft
$189/Sq Ft
Est. Value
About This Home
This home is located at 2771 N 2125 E, Layton, UT 84040 and is currently estimated at $800,827, approximately $188 per square foot. 2771 N 2125 E is a home located in Davis County with nearby schools including Mountain View Elementary School, North Layton Junior High School, and Northridge High School.
Ownership History
Date
Name
Owned For
Owner Type
Purchase Details
Closed on
Aug 1, 2014
Sold by
Klitgaard Jeffrey M
Bought by
Klitgaard Jeffrey M and Klitgaard Regina L
Current Estimated Value
Home Financials for this Owner
Home Financials are based on the most recent Mortgage that was taken out on this home.
Original Mortgage
$394,250
Outstanding Balance
$299,963
Interest Rate
4.13%
Mortgage Type
New Conventional
Estimated Equity
$500,864
Purchase Details
Closed on
May 14, 2002
Sold by
Hyde W Alan
Bought by
Hyde W Alan and Hyde Linda
Home Financials for this Owner
Home Financials are based on the most recent Mortgage that was taken out on this home.
Original Mortgage
$192,500
Interest Rate
7.13%
Purchase Details
Closed on
Jun 20, 2000
Sold by
Woodside Homes Corp
Bought by
Foote Ryan G and Foote Stacie S
Home Financials for this Owner
Home Financials are based on the most recent Mortgage that was taken out on this home.
Original Mortgage
$156,000
Interest Rate
8.63%
Purchase Details
Closed on
Sep 15, 1998
Sold by
Nmc Inc
Bought by
Hyde W Alan
Create a Home Valuation Report for This Property
The Home Valuation Report is an in-depth analysis detailing your home's value as well as a comparison with similar homes in the area
Home Values in the Area
Average Home Value in this Area
Purchase History
| Date | Buyer | Sale Price | Title Company |
|---|---|---|---|
| Klitgaard Jeffrey M | -- | Backman Title Svcs | |
| Klitgaard Jeffrey M | -- | Security Title Of Da | |
| Hyde W Alan | -- | Mountain View Title & Escrow | |
| Foote Ryan G | -- | First American Title Co | |
| Hyde W Alan | -- | Founders Title Co |
Source: Public Records
Mortgage History
| Date | Status | Borrower | Loan Amount |
|---|---|---|---|
| Open | Klitgaard Jeffrey M | $394,250 | |
| Previous Owner | Hyde W Alan | $192,500 | |
| Previous Owner | Foote Ryan G | $156,000 |
Source: Public Records
Tax History
| Year | Tax Paid | Tax Assessment Tax Assessment Total Assessment is a certain percentage of the fair market value that is determined by local assessors to be the total taxable value of land and additions on the property. | Land | Improvement |
|---|---|---|---|---|
| 2025 | $4,397 | $408,650 | $147,655 | $260,995 |
| 2024 | $4,115 | $389,400 | $145,481 | $243,919 |
| 2023 | $4,054 | $687,000 | $169,241 | $517,759 |
| 2022 | $4,322 | $402,050 | $93,003 | $309,047 |
| 2021 | $4,025 | $557,000 | $145,184 | $411,816 |
| 2020 | $3,740 | $495,000 | $133,154 | $361,846 |
| 2019 | $3,637 | $474,000 | $115,419 | $358,581 |
| 2018 | $3,407 | $445,000 | $109,136 | $335,864 |
| 2016 | $3,294 | $228,140 | $49,623 | $178,517 |
| 2015 | $3,333 | $221,870 | $49,623 | $172,247 |
| 2014 | $3,091 | $212,218 | $49,623 | $162,595 |
| 2013 | -- | $193,234 | $43,223 | $150,011 |
Source: Public Records
Map
Nearby Homes
- 1935 Deere Valley Dr
- 1911 Deere Valley Dr
- 1785 E 2825 N
- 1731 E 2825 N
- 1821 E Whitetail Way
- 2353 Canyon View Dr
- 1827 E Whitetail Dr
- 2597 N 2300 E
- 2826 N 1600 E
- 3232 N Redtail Way
- 2340 N 2050 E
- 3142 E Thorley Dr
- 3138 E Thorley Dr
- 2273 N 1975 E
- 1447 E 2700 N
- 2189 N 1950 E
- 3176 N 1450 E
- 1444 E 2400 N
- 2563 E 2250 N
- 1321 E 3125 N
- 2779 N 2125 E
- 2763 N 2125 E Unit 320
- 2763 N 2125 E
- 2749 N 2125 E
- 2766 N 2125 E
- 2778 N 2125 E
- 2789 N 2125 E
- 2754 N 2125 E
- 2743 N 2125 E
- 2746 N 2125 E
- 2746 N 2125 E Unit 311
- 2784 N 2125 E
- 2801 N 2125 E Unit 324
- 2801 N 2125 E
- 2770 Deere Valley Dr
- 2737 N 2125 E
- 2790 Deere Valley Dr
- 1918 Indian Hills Ln
- 1918 Indian Hills Ln Unit 107
- 2736 N 2125 E
Your Personal Tour Guide
Ask me questions while you tour the home.