
Landlord's Agent in 2024
Kirk Glassel
The Charles Reinhart Company
(517) 812-7038
25 in this area
181 Total Sales

Estimated Value: $322,601 - $386,000
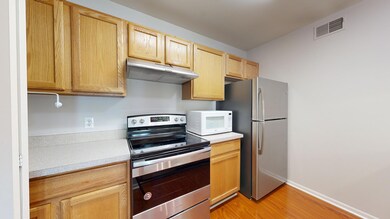
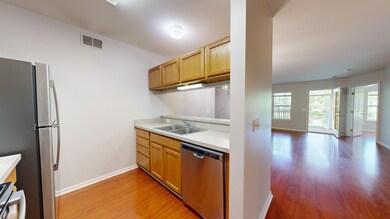
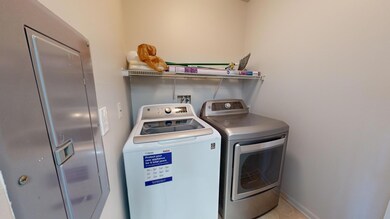
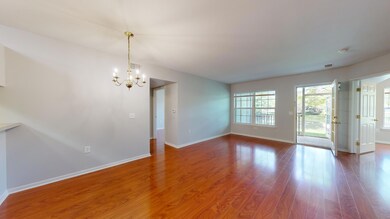
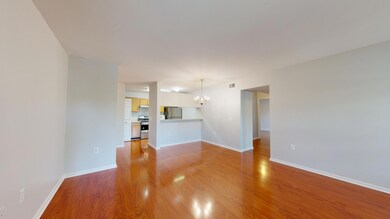
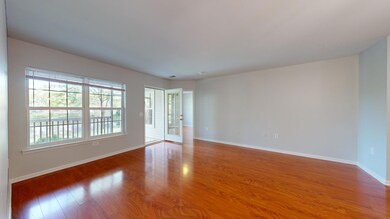
Ground level 3-BR, 2-full bathroom ranch style end unit condo that has just been freshly painted and doesn't have any carpeting in the home. Contemporary open floor plan, nice sized living and dining area leading to a screened in porch overlooking a beautiful pond and green space. Huge primary bedroom, 20 x 13, with full-bath, windows on 2 sides and great outside views. 2nd and 3rd bedrooms are good sized an additional full bathroom in the hallway. The location of the home is convenient to public transportation, UM Medical Campus, North Campus, Central Campus, Toyota, Google, Domino's Farms, grocery/restaurants, retail shopping, downtown Ann Arbor and more! 1 Car detached garage with additional free parking spaces for a second car and visitors. One year minimum lease agreement. Minimum household income of $7,200 per month. Credit scores above 700 for all adults. Would prefer to have the lease extend to at least the late spring or early summer in 2026. The landlord will certainly be interested in a multi year lease agreement.
Last Agent to Rent the Property
The Charles Reinhart Company License #6501384369 Listed on: 09/10/2024
Last Renter's Agent
The Charles Reinhart Company License #6501384369 Listed on: 09/10/2024
| Date | Buyer | Sale Price | Title Company |
|---|---|---|---|
| Hou Xinhai | $163,435 | Liberty Title Agency |
| Date | Status | Borrower | Loan Amount |
|---|---|---|---|
| Open | Hou Xinhai | $130,700 |
| Date | Event | Price | List to Sale | Price per Sq Ft |
|---|---|---|---|---|
| 10/02/2024 10/02/24 | Rented | $2,400 | 0.0% | -- |
| 09/10/2024 09/10/24 | For Rent | $2,400 | +50.0% | -- |
| 01/28/2021 01/28/21 | Rented | $1,600 | 0.0% | -- |
| 01/24/2021 01/24/21 | Under Contract | -- | -- | -- |
| 12/05/2020 12/05/20 | For Rent | $1,600 | 0.0% | -- |
| 10/24/2019 10/24/19 | Rented | $1,600 | 0.0% | -- |
| 10/24/2019 10/24/19 | Under Contract | -- | -- | -- |
| 10/21/2019 10/21/19 | For Rent | $1,600 | +23.1% | -- |
| 02/15/2014 02/15/14 | Rented | $1,300 | 0.0% | -- |
| 02/15/2014 02/15/14 | Under Contract | -- | -- | -- |
| 01/17/2014 01/17/14 | For Rent | $1,300 | +8.3% | -- |
| 06/29/2012 06/29/12 | Rented | $1,200 | 0.0% | -- |
| 04/15/2012 04/15/12 | Under Contract | -- | -- | -- |
| 04/09/2012 04/09/12 | For Rent | $1,200 | -- | -- |
| Year | Tax Paid | Tax Assessment Tax Assessment Total Assessment is a certain percentage of the fair market value that is determined by local assessors to be the total taxable value of land and additions on the property. | Land | Improvement |
|---|---|---|---|---|
| 2025 | $5,412 | $127,400 | $0 | $0 |
| 2024 | $5,264 | $114,800 | $0 | $0 |
| 2023 | $4,861 | $110,800 | $0 | $0 |
| 2022 | $5,883 | $121,800 | $0 | $0 |
| 2021 | $5,717 | $122,200 | $0 | $0 |
| 2020 | $5,619 | $114,100 | $0 | $0 |
| 2019 | $5,281 | $109,400 | $109,400 | $0 |
| 2018 | $5,182 | $97,200 | $0 | $0 |
| 2017 | $6,276 | $96,400 | $0 | $0 |
| 2016 | $4,871 | $78,721 | $0 | $0 |
| 2015 | $5,060 | $78,486 | $0 | $0 |
| 2014 | $5,060 | $76,034 | $0 | $0 |
| 2013 | -- | $76,034 | $0 | $0 |
Landlord's Agent in 2024
Kirk Glassel
The Charles Reinhart Company
(517) 812-7038
25 in this area
181 Total Sales
Z
Seller's Agent in 2021
Zen Chen
RE/MAX
(248) 767-1343
68 Total Sales
Z
Seller's Agent in 2019
Zheng Huang
BlueSky Realty
Buyer's Agent in 2014
Alex Milshteyn
Real Estate One Inc
(734) 417-3560
53 in this area
1,126 Total Sales
A
Buyer's Agent in 2014
Aleksandr Milshteyn
Howard Hanna Real Estate
J
Seller's Agent in 2012
Jade Zhang
BlueSky Realty
Source: MichRIC
MLS Number: 24047694
APN: 09-16-200-068
Disclaimer: Certain information contained herein is derived from information provided by parties other than Homes.com. All information provided is deemed reliable, but is not guaranteed to be accurate and should be independently verified.
![]() Information is deemed reliable but not guaranteed.
Information is deemed reliable but not guaranteed.
Copyright 2025 MichRIC, LLC. All rights reserved.