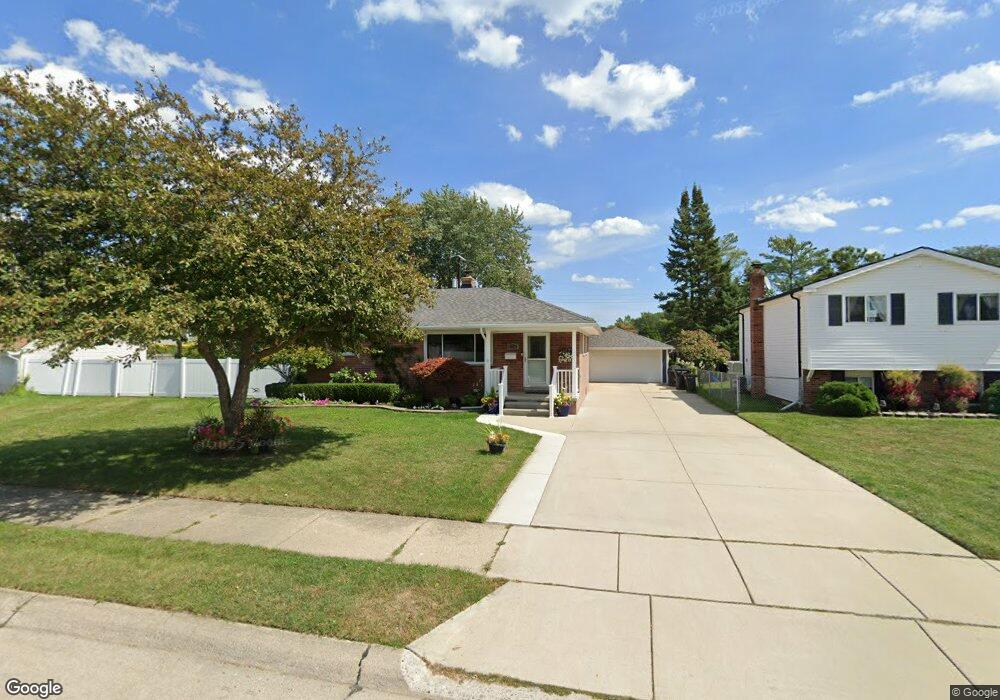
27716 Floral St Roseville, MI 48066
Estimated Value: $208,000 - $247,000
3
Beds
2
Baths
1,746
Sq Ft
$127/Sq Ft
Est. Value
About This Home
This home is located at 27716 Floral St, Roseville, MI 48066 and is currently estimated at $222,463, approximately $127 per square foot. 27716 Floral St is a home located in Macomb County with nearby schools including Joseph G. Steenland Elementary School, Fountain Elementary School, and Dort Elementary School.
Ownership History
Date
Name
Owned For
Owner Type
Purchase Details
Closed on
Apr 1, 2019
Sold by
Vue Yee Leng
Bought by
Lor Neng and Lor Sophea
Current Estimated Value
Purchase Details
Closed on
Jun 16, 2010
Sold by
Donovan Shaun and Secretary Of Housing & Urban D
Bought by
Vue Yeeleng
Purchase Details
Closed on
Oct 5, 2009
Sold by
Wells Fargo Bank Na
Bought by
The Secretary Of Housing & Urban Develop
Purchase Details
Closed on
Apr 3, 2009
Sold by
Lewis James P and Hill Beth M
Bought by
Wells Fargo Bank Na
Purchase Details
Closed on
Dec 12, 2001
Sold by
Labelle Edward
Bought by
Lewis James P
Home Financials for this Owner
Home Financials are based on the most recent Mortgage that was taken out on this home.
Original Mortgage
$141,338
Interest Rate
7.23%
Purchase Details
Closed on
Mar 4, 1999
Sold by
Cifolelli Judith M
Bought by
Labelle Edward
Create a Home Valuation Report for This Property
The Home Valuation Report is an in-depth analysis detailing your home's value as well as a comparison with similar homes in the area
Home Values in the Area
Average Home Value in this Area
Purchase History
| Date | Buyer | Sale Price | Title Company |
|---|---|---|---|
| Lor Neng | -- | None Available | |
| Vue Yeeleng | $37,000 | None Available | |
| The Secretary Of Housing & Urban Develop | -- | None Available | |
| Wells Fargo Bank Na | $139,616 | None Available | |
| Lewis James P | $142,500 | -- | |
| Labelle Edward | $101,000 | -- |
Source: Public Records
Mortgage History
| Date | Status | Borrower | Loan Amount |
|---|---|---|---|
| Previous Owner | Lewis James P | $141,338 |
Source: Public Records
Tax History Compared to Growth
Tax History
| Year | Tax Paid | Tax Assessment Tax Assessment Total Assessment is a certain percentage of the fair market value that is determined by local assessors to be the total taxable value of land and additions on the property. | Land | Improvement |
|---|---|---|---|---|
| 2025 | $2,850 | $101,400 | $0 | $0 |
| 2024 | $1,512 | $95,900 | $0 | $0 |
| 2023 | $1,450 | $89,000 | $0 | $0 |
| 2022 | $2,546 | $80,100 | $0 | $0 |
| 2021 | $2,472 | $75,600 | $0 | $0 |
| 2020 | $1,411 | $58,700 | $0 | $0 |
| 2019 | $2,169 | $55,200 | $0 | $0 |
| 2018 | $2,128 | $0 | $0 | $0 |
| 2017 | $1,986 | $43,228 | $6,802 | $36,426 |
| 2016 | $1,974 | $43,228 | $0 | $0 |
| 2015 | $1,278 | $38,681 | $0 | $0 |
| 2013 | -- | $38,196 | $0 | $0 |
| 2011 | -- | $48,314 | $0 | $0 |
Source: Public Records
Map
Nearby Homes
- 27639 Bohn St
- 27503 Edward St
- 27250 Edward St
- 28212 Floral St
- 28222 Bohn St
- 28410 Bohn St
- 28319 Waverly St
- 17484 Lowell St
- 28703 Groveland St
- 26834 Greenleaf St
- 17631 Roseville Blvd
- 27241 Woodmont St
- 27130 Woodmont St
- 27100 Woodmont St
- 26730 Ridgemont St
- 28633 Citation Dr
- 17456 Allen St
- 28824 Bohn St
- 28320 Hillview St
- 16804 E 12 Mile Rd
- 27664 Floral St
- 27780 Floral St
- 27650 Floral St
- 27717 Groveland St
- 27636 Floral St
- 27790 Floral St
- 27649 Groveland St
- 27799 Groveland St
- 27717 Floral St
- 27737 Floral St
- 27663 Floral St
- 27649 Floral St
- 27799 Floral St
- 27635 Groveland St
- 27809 Groveland St
- 27622 Floral St
- 27800 Floral St
- 27635 Floral St
- 27809 Floral St
- 27621 Groveland St