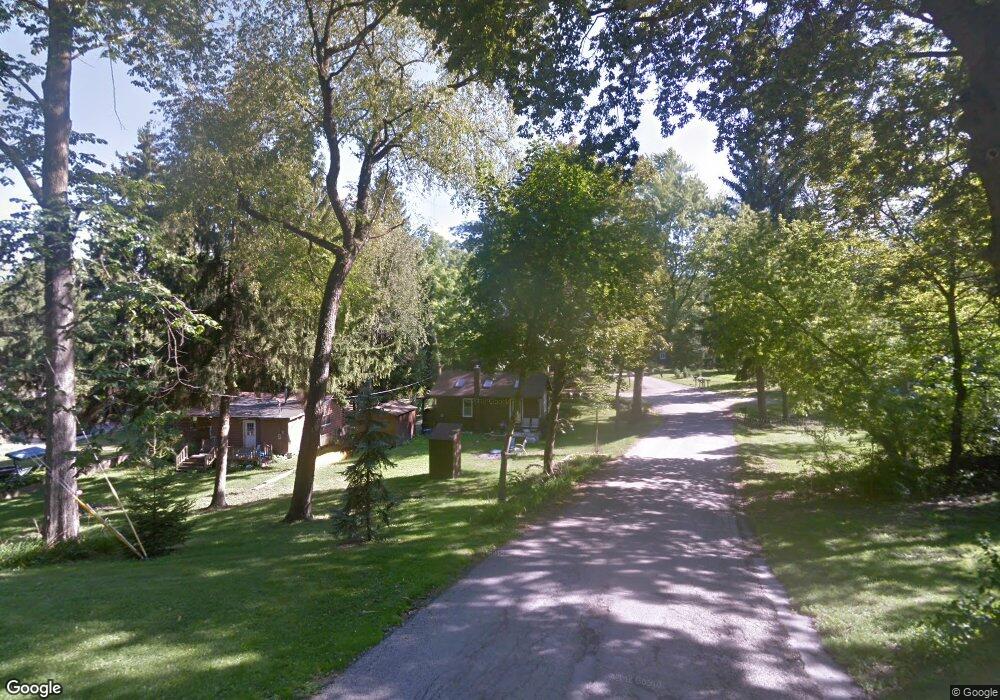
27720 W Rowe Ave Spring Grove, IL 60081
Northeast Fox Lake NeighborhoodEstimated Value: $128,874 - $178,000
2
Beds
1
Bath
700
Sq Ft
$211/Sq Ft
Est. Value
About This Home
This home is located at 27720 W Rowe Ave, Spring Grove, IL 60081 and is currently estimated at $147,969, approximately $211 per square foot. 27720 W Rowe Ave is a home located in Lake County with nearby schools including Lotus Elementary School, Stanton Middle School, and Grant Community High School.
Ownership History
Date
Name
Owned For
Owner Type
Purchase Details
Closed on
Jun 10, 2013
Sold by
Schmidt Jay D
Bought by
J D Schmidt Llc
Current Estimated Value
Purchase Details
Closed on
Apr 25, 2011
Sold by
Schmidt Sally M and Schmidt Michael F
Bought by
Schmidt Jay D
Purchase Details
Closed on
May 25, 2001
Sold by
Schilli Jason M
Bought by
Schmidt Michael F and Schmidt Sally M
Home Financials for this Owner
Home Financials are based on the most recent Mortgage that was taken out on this home.
Original Mortgage
$68,160
Interest Rate
7.18%
Purchase Details
Closed on
May 30, 1997
Sold by
Link Henry and Link Denice
Bought by
Schill Jason M
Home Financials for this Owner
Home Financials are based on the most recent Mortgage that was taken out on this home.
Original Mortgage
$78,000
Interest Rate
8.13%
Mortgage Type
FHA
Purchase Details
Closed on
Oct 7, 1996
Sold by
Dresser Paula
Bought by
Link Henry and Link Denice
Create a Home Valuation Report for This Property
The Home Valuation Report is an in-depth analysis detailing your home's value as well as a comparison with similar homes in the area
Home Values in the Area
Average Home Value in this Area
Purchase History
| Date | Buyer | Sale Price | Title Company |
|---|---|---|---|
| J D Schmidt Llc | -- | None Available | |
| Schmidt Jay D | -- | None Available | |
| Schmidt Michael F | $85,500 | Imperial Land Title Inc | |
| Schill Jason M | $78,500 | Blackhawk Title Services | |
| Link Henry | $40,000 | -- |
Source: Public Records
Mortgage History
| Date | Status | Borrower | Loan Amount |
|---|---|---|---|
| Previous Owner | Schmidt Michael F | $68,160 | |
| Previous Owner | Schill Jason M | $78,000 |
Source: Public Records
Tax History
| Year | Tax Paid | Tax Assessment Tax Assessment Total Assessment is a certain percentage of the fair market value that is determined by local assessors to be the total taxable value of land and additions on the property. | Land | Improvement |
|---|---|---|---|---|
| 2024 | $2,282 | $31,823 | $3,301 | $28,522 |
| 2023 | $2,072 | $28,495 | $2,956 | $25,539 |
| 2022 | $2,072 | $25,001 | $3,203 | $21,798 |
| 2021 | $1,990 | $23,329 | $2,989 | $20,340 |
| 2020 | $1,960 | $22,684 | $2,906 | $19,778 |
| 2019 | $1,852 | $21,693 | $2,779 | $18,914 |
| 2018 | $1,629 | $18,616 | $2,804 | $15,812 |
| 2017 | $1,614 | $17,719 | $2,669 | $15,050 |
| 2016 | $1,728 | $17,100 | $2,576 | $14,524 |
| 2015 | $1,745 | $19,163 | $2,510 | $16,653 |
| 2014 | $2,270 | $22,859 | $5,597 | $17,262 |
| 2012 | $2,219 | $23,768 | $5,597 | $18,171 |
Source: Public Records
Map
Nearby Homes
- 27580 W Stonegate Dr
- 38227 N 3rd Ave
- 38480 N 6th Ave
- 27771 W Lake Shore Dr
- 27726 Hill Dr
- Lots 11 & 12 W Ravine Dr
- Lots 8 & 9 W Ravine Dr
- 39175 NW End Dr
- 39091 N Mound Ave
- 38717 N Lake St
- 8226 Cinnamon Ln Unit H4D
- 8300 Reva Bay Ln Unit SLIP4
- 8300 Reva Bay Ln Unit SLIP5
- 8421 Canary Grass Ln Unit 8421
- 39080 N Jackson Dr
- 7105 Saint Tropez Ct Unit 297
- 7205 Hastings Cir Unit 330
- 171 Waltonian Terrace
- 28624 W Kendall Ave
- 7202 Oxford Cir Unit 237
- 27708 W Rowe Ave
- 38380 N Briar Rd
- 27686 W Rowe Ave
- 38414 N Briar Rd
- 38402 N Briar Rd
- 38421 N Briar Rd
- 27676 W Rowe Ave
- 27695 W Rowe Ave
- 38422 N Briar Rd
- 38346 N Briar Rd
- 38437 N Briar Rd
- 27677 W Stonegate Dr
- 38381 N 3rd Ave
- 38377 N 3rd Ave
- 38407 N 3rd Ave
- 38332 N Briar Rd
- 38365 N 3rd Ave
- 38364 N Hamilton Cir
- 38417 N 3rd Ave
- 38351 N 3rd Ave
Your Personal Tour Guide
Ask me questions while you tour the home.