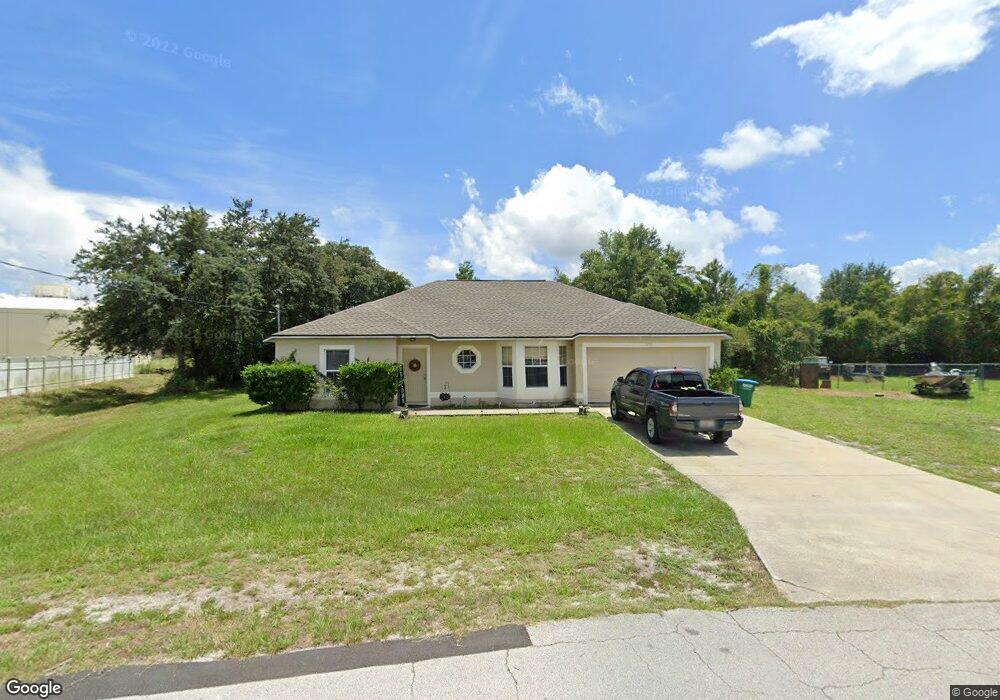
2773 S Huron Dr Deltona, FL 32738
Estimated Value: $286,912 - $317,000
3
Beds
2
Baths
1,555
Sq Ft
$192/Sq Ft
Est. Value
About This Home
This home is located at 2773 S Huron Dr, Deltona, FL 32738 and is currently estimated at $299,228, approximately $192 per square foot. 2773 S Huron Dr is a home located in Volusia County with nearby schools including Volusia Pines Elementary School, Galaxy Middle School, and Pine Ridge High School.
Ownership History
Date
Name
Owned For
Owner Type
Purchase Details
Closed on
Jul 25, 2005
Sold by
Belcher Kevin D and Belcher Noelle D
Bought by
Dalton Jack C and Dalton Suzanne N
Current Estimated Value
Home Financials for this Owner
Home Financials are based on the most recent Mortgage that was taken out on this home.
Original Mortgage
$146,440
Outstanding Balance
$76,580
Interest Rate
5.59%
Mortgage Type
Fannie Mae Freddie Mac
Estimated Equity
$222,648
Purchase Details
Closed on
Mar 30, 1999
Sold by
Maronda Homes Inc Fl
Bought by
Belcher Kevin D and Wolfe Noelle D
Home Financials for this Owner
Home Financials are based on the most recent Mortgage that was taken out on this home.
Original Mortgage
$70,630
Interest Rate
6.85%
Mortgage Type
Purchase Money Mortgage
Purchase Details
Closed on
Jul 15, 1971
Bought by
Dalton Jack C
Create a Home Valuation Report for This Property
The Home Valuation Report is an in-depth analysis detailing your home's value as well as a comparison with similar homes in the area
Home Values in the Area
Average Home Value in this Area
Purchase History
| Date | Buyer | Sale Price | Title Company |
|---|---|---|---|
| Dalton Jack C | $183,050 | Vision Title Of Deland Llc | |
| Belcher Kevin D | $70,000 | -- | |
| Dalton Jack C | $1,200 | -- |
Source: Public Records
Mortgage History
| Date | Status | Borrower | Loan Amount |
|---|---|---|---|
| Open | Dalton Jack C | $146,440 | |
| Previous Owner | Belcher Kevin D | $70,630 |
Source: Public Records
Tax History Compared to Growth
Tax History
| Year | Tax Paid | Tax Assessment Tax Assessment Total Assessment is a certain percentage of the fair market value that is determined by local assessors to be the total taxable value of land and additions on the property. | Land | Improvement |
|---|---|---|---|---|
| 2025 | $4,161 | $267,446 | $68,275 | $199,171 |
| 2024 | $4,161 | $267,970 | $68,275 | $199,695 |
| 2023 | $4,161 | $255,830 | $71,006 | $184,824 |
| 2022 | $3,786 | $211,327 | $45,320 | $166,007 |
| 2021 | $3,572 | $170,943 | $31,930 | $139,013 |
| 2020 | $3,320 | $160,770 | $29,084 | $131,686 |
| 2019 | $3,309 | $169,281 | $35,805 | $133,476 |
| 2018 | $3,025 | $143,408 | $22,677 | $120,731 |
| 2017 | $2,788 | $122,521 | $17,938 | $104,583 |
| 2016 | $2,390 | $89,623 | $0 | $0 |
| 2015 | $2,246 | $80,314 | $0 | $0 |
| 2014 | $2,137 | $77,311 | $0 | $0 |
Source: Public Records
Map
Nearby Homes
- 2816 S Elston Dr
- 2780 W Covington Dr
- 3057 Avon Ct
- 0 Riverhead Dr
- 2861 Brighton Ave
- 2980 Gimlet Dr
- 2689 Courtland Blvd
- 2848 Jewel Ave
- 3079 Pigeon Cove St
- 3259 Butterfield St
- 3036 Beal St
- 3267 Butterfield St
- 2990 N Covington Dr
- 3197 Riverhead Dr
- 2824 Corrigan Dr
- 2889 Boyd Ct
- 3155 Pigeon Cove St
- 3095 Pigeon Cove St
- 3138 Croton Ave
- 0 Tudor St
- 2773 S Huron Dr
- 2782 W Huron Dr
- 2765 S Huron Dr
- 2780 S Huron Dr
- 2788 W Huron Dr
- 2757 S Huron Dr
- 2781 Courtland Blvd
- 2773 Courtland Blvd
- 2789 Courtland Blvd
- 2765 Courtland Blvd
- 2825 Gimlet Dr
- 2797 Courtland Blvd
- 2796 W Huron Dr
- 2749 S Huron Dr
- 2764 S Huron Dr
- 2757 Courtland Blvd
- 2833 Gimlet Dr
- 2801 Courtland Blvd
- 2741 S Huron Dr
- 2841 Gimlet Dr