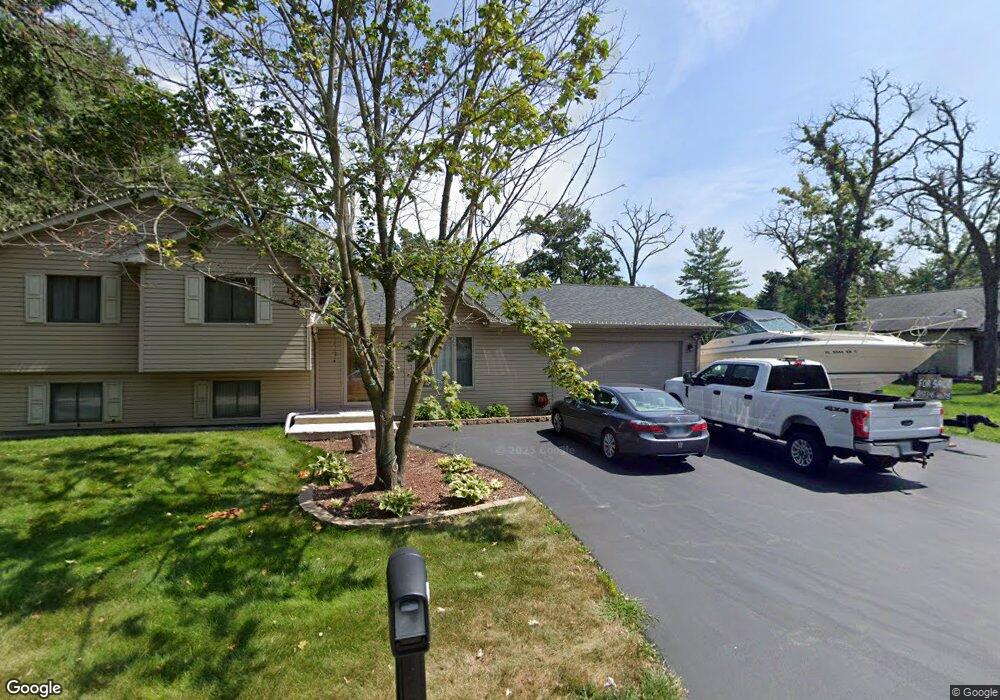
27731 N Beech St Island Lake, IL 60042
Slocum Lake NeighborhoodEstimated Value: $260,000 - $299,000
3
Beds
2
Baths
1,128
Sq Ft
$246/Sq Ft
Est. Value
About This Home
This home is located at 27731 N Beech St, Island Lake, IL 60042 and is currently estimated at $277,730, approximately $246 per square foot. 27731 N Beech St is a home located in Lake County with nearby schools including Cotton Creek School, Matthews Middle School, and Wauconda High School.
Ownership History
Date
Name
Owned For
Owner Type
Purchase Details
Closed on
Nov 26, 2012
Sold by
Gainer Christi A
Bought by
Seiwerth Daniel M and Seiwerth Fatima
Current Estimated Value
Home Financials for this Owner
Home Financials are based on the most recent Mortgage that was taken out on this home.
Original Mortgage
$102,845
Outstanding Balance
$74,613
Interest Rate
4.4%
Mortgage Type
FHA
Estimated Equity
$203,117
Purchase Details
Closed on
Mar 26, 2003
Sold by
Gainer Alan L
Bought by
Gainer Christi A
Home Financials for this Owner
Home Financials are based on the most recent Mortgage that was taken out on this home.
Original Mortgage
$153,000
Interest Rate
7.3%
Mortgage Type
Purchase Money Mortgage
Purchase Details
Closed on
Aug 28, 1997
Sold by
Martin Walter R and Martin Miriam A
Bought by
Gainer Alan L and Gainer Christi A
Home Financials for this Owner
Home Financials are based on the most recent Mortgage that was taken out on this home.
Original Mortgage
$140,031
Interest Rate
7.55%
Mortgage Type
FHA
Create a Home Valuation Report for This Property
The Home Valuation Report is an in-depth analysis detailing your home's value as well as a comparison with similar homes in the area
Home Values in the Area
Average Home Value in this Area
Purchase History
| Date | Buyer | Sale Price | Title Company |
|---|---|---|---|
| Seiwerth Daniel M | $107,500 | Attorneys Title Guaranty Fun | |
| Gainer Christi A | -- | Law Title Ins Co | |
| Gainer Alan L | $95,000 | Plm Title Company |
Source: Public Records
Mortgage History
| Date | Status | Borrower | Loan Amount |
|---|---|---|---|
| Open | Seiwerth Daniel M | $102,845 | |
| Previous Owner | Gainer Christi A | $153,000 | |
| Previous Owner | Gainer Alan L | $140,031 |
Source: Public Records
Tax History Compared to Growth
Tax History
| Year | Tax Paid | Tax Assessment Tax Assessment Total Assessment is a certain percentage of the fair market value that is determined by local assessors to be the total taxable value of land and additions on the property. | Land | Improvement |
|---|---|---|---|---|
| 2024 | $4,126 | $67,019 | $9,232 | $57,787 |
| 2023 | $4,375 | $61,261 | $8,439 | $52,822 |
| 2022 | $4,375 | $56,821 | $9,139 | $47,682 |
| 2021 | $4,165 | $53,691 | $8,636 | $45,055 |
| 2020 | $4,102 | $50,220 | $8,231 | $41,989 |
| 2019 | $3,572 | $47,462 | $7,779 | $39,683 |
| 2018 | $3,323 | $41,053 | $9,227 | $31,826 |
| 2017 | $3,315 | $40,578 | $9,120 | $31,458 |
| 2016 | $3,128 | $38,426 | $8,636 | $29,790 |
| 2015 | $2,979 | $35,276 | $7,928 | $27,348 |
| 2014 | $2,995 | $35,196 | $8,309 | $26,887 |
| 2012 | $4,023 | $48,007 | $8,459 | $39,548 |
Source: Public Records
Map
Nearby Homes
- 27692 N Oak St
- 27569 N Beech St
- 4410 Shooting Star Ct
- 27405 N Roberts Ln
- 3828 Eastway Dr
- 4342 Shooting Star Dr Unit 142
- 3819 Woodlawn Dr
- 228 S Shore Dr
- 216 S Shore Dr Unit S
- 28094 E State Rd
- 114 Maple St
- Lot 0 S Pine St
- 108 Poplar St
- 28406 W Park Ave
- 26958 N Ellen St
- 6 Lots Porten Rd
- NEC Route 176 & Westridge Dr
- 26824 N Poplar St
- 4504 Vista Dr
- 236 Forest Dr
- 27725 N Beech St
- 27719 N Beech St
- 27740 N Hickory St
- 27709 N Beech St
- 27718 N Hickory St
- 27771 N Beech St
- 27708 N Hickory St
- 27822 N Beech St
- 27830 N Beech St
- 27771 Beech St
- 27692 N Hickory St
- 27766 N Beech St
- 27731 N Hickory St
- 27676 N Hickory St
- 27719 N Hickory St
- 27787 N Converse Rd
- 27625 N Hickory St
- 27693 N Hickory St
- 27672 N Hickory St
- 27811 N Beech St