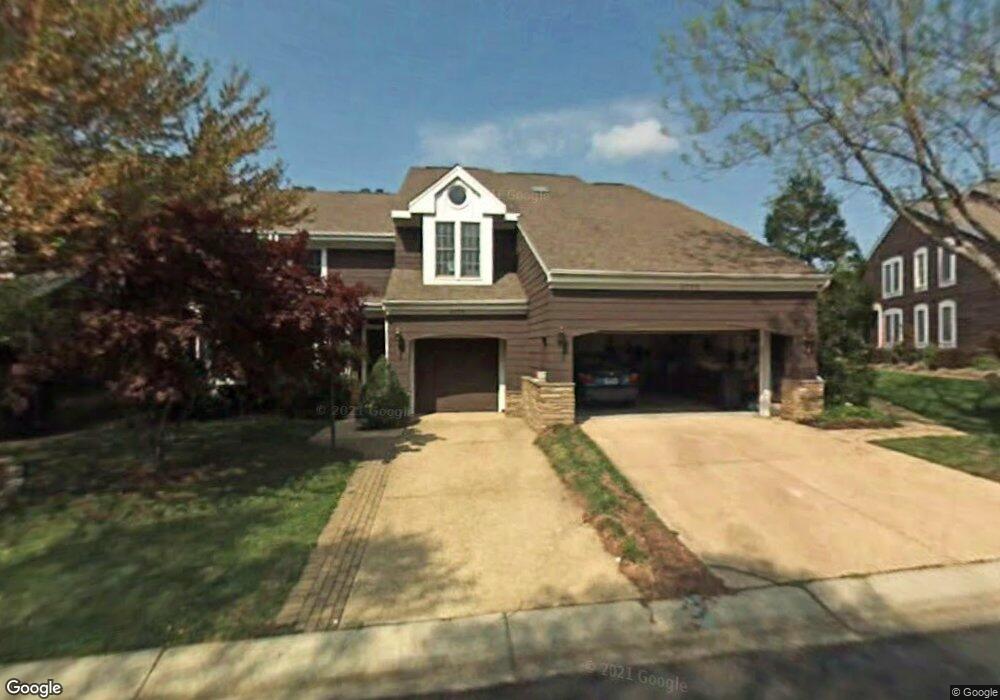
2774 Gingerview Ln Annapolis, MD 21401
Parole NeighborhoodEstimated Value: $615,298 - $714,000
4
Beds
4
Baths
2,545
Sq Ft
$259/Sq Ft
Est. Value
About This Home
This home is located at 2774 Gingerview Ln, Annapolis, MD 21401 and is currently estimated at $659,575, approximately $259 per square foot. 2774 Gingerview Ln is a home located in Anne Arundel County with nearby schools including Rolling Knolls Elementary School, Wiley H. Bates Middle School, and Annapolis High School.
Ownership History
Date
Name
Owned For
Owner Type
Purchase Details
Closed on
Feb 20, 2020
Sold by
Connor Janellen O
Bought by
Jan O Connor Living Trust and Janellen O Connor Living Trust
Current Estimated Value
Purchase Details
Closed on
Jul 31, 2015
Sold by
Olson Renee M
Bought by
Connor Janellen O
Home Financials for this Owner
Home Financials are based on the most recent Mortgage that was taken out on this home.
Original Mortgage
$175,001
Outstanding Balance
$137,871
Interest Rate
4.08%
Mortgage Type
New Conventional
Estimated Equity
$521,704
Purchase Details
Closed on
Jan 28, 1999
Sold by
Flury Steven H
Bought by
Olson Renee M
Purchase Details
Closed on
Nov 25, 1992
Sold by
Gutenson Charles E
Bought by
Flury Steven H
Home Financials for this Owner
Home Financials are based on the most recent Mortgage that was taken out on this home.
Original Mortgage
$131,000
Interest Rate
8.32%
Create a Home Valuation Report for This Property
The Home Valuation Report is an in-depth analysis detailing your home's value as well as a comparison with similar homes in the area
Home Values in the Area
Average Home Value in this Area
Purchase History
| Date | Buyer | Sale Price | Title Company |
|---|---|---|---|
| Jan O Connor Living Trust | -- | None Available | |
| Connor Janellen O | $458,000 | Easten Shore Title Company | |
| Olson Renee M | $265,000 | -- | |
| Flury Steven H | $225,000 | -- |
Source: Public Records
Mortgage History
| Date | Status | Borrower | Loan Amount |
|---|---|---|---|
| Open | Connor Janellen O | $175,001 | |
| Previous Owner | Flury Steven H | $131,000 |
Source: Public Records
Tax History
| Year | Tax Paid | Tax Assessment Tax Assessment Total Assessment is a certain percentage of the fair market value that is determined by local assessors to be the total taxable value of land and additions on the property. | Land | Improvement |
|---|---|---|---|---|
| 2025 | $5,660 | $507,700 | -- | -- |
| 2024 | $5,660 | $488,700 | $0 | $0 |
| 2023 | $5,090 | $469,700 | $185,000 | $284,700 |
| 2022 | $5,151 | $459,400 | $0 | $0 |
| 2020 | $4,924 | $438,800 | $170,000 | $268,800 |
| 2019 | $4,379 | $435,333 | $0 | $0 |
| 2018 | $4,379 | $431,867 | $0 | $0 |
| 2017 | $4,534 | $428,400 | $0 | $0 |
| 2016 | -- | $409,133 | $0 | $0 |
| 2015 | -- | $389,867 | $0 | $0 |
| 2014 | -- | $370,600 | $0 | $0 |
Source: Public Records
Map
Nearby Homes
- 2757 Gingerview Ln
- 2707 Summerview Way Unit 101
- 2702 Summerview Way Unit 303
- 2704 Summerview Way Unit 302
- 2704 Summerview Way Unit 103
- 3029 Solstice Ln
- 2707 Judson Place
- 301 Unity Ln
- 251 Cape Saint John Rd
- 2725 Cabernet Ln
- 204 Burgundy Ln
- 371 Carriage Park Way
- 328 Bulwark Aly
- 321 Bulwark Aly
- 547 Leftwich Ln Unit 88
- 2555 Riva Rd
- 108 Sellew Rd
- 109 Sellew Rd
- 208 Sellew Rd
- 27 Old South River Rd
- 2774 Gingerview Ln Unit 3
- 2776 Gingerview Ln
- 2778 Gingerview Ln
- 2778 Gingerview Ln Unit 1
- 2770 Gingerview Ln
- 2768 Gingerview Ln
- 2773 Gingerview Ln
- 2771 Gingerview Ln
- 2775 Gingerview Ln
- 2775 Gingerview Ln Unit 94
- 2775 Gingerview Ln Unit A
- 2766 Gingerview Ln
- 2766 Gingerview Ln Unit 7
- 2777 Gingerview Ln
- 2761 Gingerview Ln
- 2761 Gingerview Ln Unit 97
- 2764 Gingerview Ln
- 2759 Gingerview Ln
- 2762 Gingerview Ln
- 142 Summer Village Dr