Estimated Value: $557,000 - $602,000
5
Beds
4
Baths
1,955
Sq Ft
$294/Sq Ft
Est. Value
About This Home
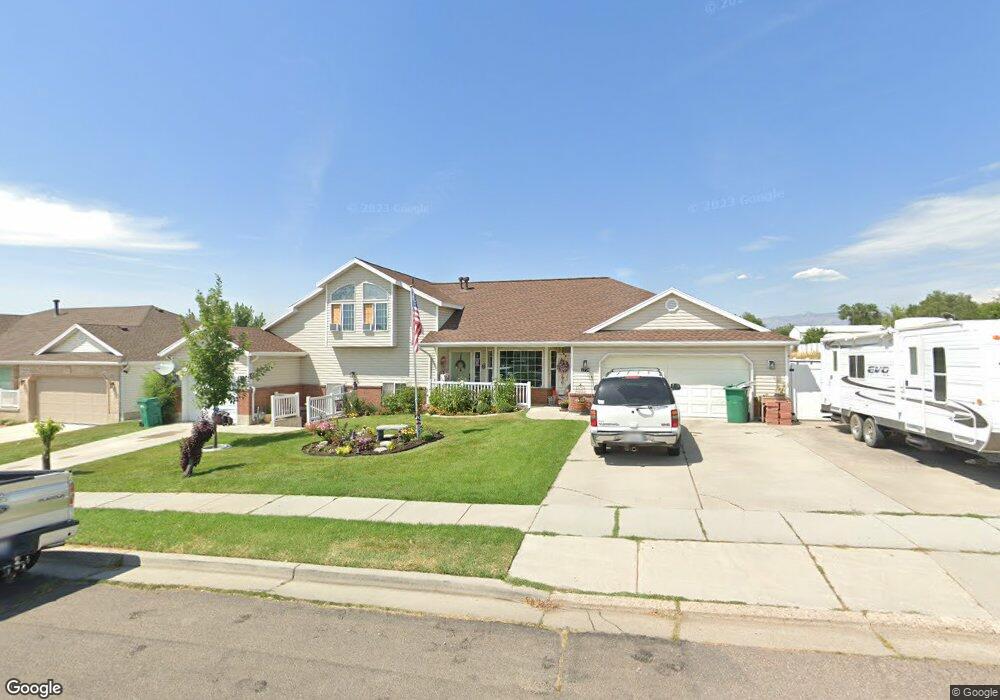
This home is located at 2774 W 5200 S, Roy, UT 84067 and is currently estimated at $573,893, approximately $293 per square foot. 2774 W 5200 S is a home with nearby schools including Midland School, Sand Ridge Junior High School, and Roy High School.
Ownership History
Date
Name
Owned For
Owner Type
Purchase Details
Closed on
Jul 21, 2021
Sold by
Robertson Thomas and Robertson Jane
Bought by
Knight Koni Kay and Knight Lawrence Stewart
Current Estimated Value
Home Financials for this Owner
Home Financials are based on the most recent Mortgage that was taken out on this home.
Original Mortgage
$271,300
Outstanding Balance
$246,388
Interest Rate
2.96%
Mortgage Type
New Conventional
Estimated Equity
$327,505
Purchase Details
Closed on
May 23, 2005
Sold by
Jeffries James L
Bought by
Robertson Thomas and Robertson Jane
Home Financials for this Owner
Home Financials are based on the most recent Mortgage that was taken out on this home.
Original Mortgage
$166,000
Interest Rate
5.87%
Mortgage Type
New Conventional
Purchase Details
Closed on
May 7, 2005
Sold by
Richins Brandon S
Bought by
Jeffries James L
Home Financials for this Owner
Home Financials are based on the most recent Mortgage that was taken out on this home.
Original Mortgage
$166,000
Interest Rate
5.87%
Mortgage Type
New Conventional
Purchase Details
Closed on
Jan 7, 2005
Sold by
Richins Faye B
Bought by
Richins Brandon S
Purchase Details
Closed on
Jan 16, 2001
Sold by
Richins Thomas M
Bought by
Richins Brandon S and Richins Faye B
Home Financials for this Owner
Home Financials are based on the most recent Mortgage that was taken out on this home.
Original Mortgage
$189,000
Interest Rate
7.71%
Purchase Details
Closed on
Dec 22, 2000
Sold by
Richins Thomas M
Bought by
Richins Thomas M and Richins Brandon S
Home Financials for this Owner
Home Financials are based on the most recent Mortgage that was taken out on this home.
Original Mortgage
$189,000
Interest Rate
7.71%
Purchase Details
Closed on
Apr 28, 2000
Sold by
Hyde & Watkins Development Llc
Bought by
Richins Faye B and Richins Brandon S
Home Financials for this Owner
Home Financials are based on the most recent Mortgage that was taken out on this home.
Original Mortgage
$168,000
Interest Rate
8.25%
Purchase Details
Closed on
Apr 27, 1998
Sold by
Hatch Clark J and Hatch Julie
Bought by
Hyde & Watkins Development Llc
Create a Home Valuation Report for This Property
The Home Valuation Report is an in-depth analysis detailing your home's value as well as a comparison with similar homes in the area
Home Values in the Area
Average Home Value in this Area
Purchase History
| Date | Buyer | Sale Price | Title Company |
|---|---|---|---|
| Knight Koni Kay | -- | Pinnacle Title | |
| Robertson Thomas | -- | -- | |
| Jeffries James L | -- | Backman | |
| Richins Brandon S | -- | Backman Stewart Title | |
| Richins Brandon S | -- | U S Title | |
| Richins Thomas M | -- | Us Title | |
| Richins Thomas M | -- | U S Title | |
| Richins Faye S | -- | U S Title | |
| Richins Faye B | -- | U S Title | |
| Hyde & Watkins Development Llc | -- | -- |
Source: Public Records
Mortgage History
| Date | Status | Borrower | Loan Amount |
|---|---|---|---|
| Open | Knight Koni Kay | $271,300 | |
| Previous Owner | Robertson Thomas | $166,000 | |
| Previous Owner | Robertson Thomas | $20,750 | |
| Previous Owner | Richins Faye S | $189,000 | |
| Previous Owner | Richins Faye B | $168,000 | |
| Closed | Richins Faye B | $30,000 | |
| Closed | Richins Faye S | $12,000 |
Source: Public Records
Tax History Compared to Growth
Tax History
| Year | Tax Paid | Tax Assessment Tax Assessment Total Assessment is a certain percentage of the fair market value that is determined by local assessors to be the total taxable value of land and additions on the property. | Land | Improvement |
|---|---|---|---|---|
| 2025 | $3,659 | $597,448 | $138,432 | $459,016 |
| 2024 | $3,490 | $315,149 | $76,137 | $239,012 |
| 2023 | $3,207 | $288,750 | $67,930 | $220,820 |
| 2022 | $3,186 | $294,250 | $57,766 | $236,484 |
| 2021 | $2,900 | $444,000 | $50,000 | $394,000 |
| 2020 | $2,290 | $317,000 | $79,978 | $237,022 |
| 2019 | $2,126 | $276,000 | $44,949 | $231,051 |
| 2018 | $2,217 | $273,308 | $40,012 | $233,296 |
| 2017 | $1,549 | $172,494 | $39,951 | $132,543 |
| 2016 | $1,432 | $85,248 | $22,000 | $63,248 |
| 2015 | $1,393 | $85,248 | $22,000 | $63,248 |
| 2014 | $1,590 | $98,216 | $22,000 | $76,216 |
Source: Public Records
Map
Nearby Homes
- 5056 S 2800 W
- 5063 S 2825 W
- 5003 S 2825 W
- 5317 S 2690 W
- 5009 S 2925 W
- 4918 S 2925 W
- 4919 S 2675 W
- 5326 S 2675 W
- 5024 S 2575 W
- 4891 S 2875 W
- 4875 S 2675 W
- 2778 W 5550 S Unit 28
- 2786 W 5550 S Unit C11
- 5321 S 3100 W
- 5345 S 2425 W
- 3046 W 4850 S
- 5432 S 3150 W
- 2646 W 5625 S Unit M-2646
- 2411 W 4900 S
- 3014 W 4750 S