2775 N Carnoustie Loop Lecanto, FL 34461
Black Diamond NeighborhoodEstimated Value: $490,069 - $621,000
3
Beds
3
Baths
2,406
Sq Ft
$239/Sq Ft
Est. Value
About This Home
This home is located at 2775 N Carnoustie Loop, Lecanto, FL 34461 and is currently estimated at $574,517, approximately $238 per square foot. 2775 N Carnoustie Loop is a home located in Citrus County with nearby schools including Central Ridge Elementary School, Citrus Springs Middle School, and Lecanto High School.
Ownership History
Date
Name
Owned For
Owner Type
Purchase Details
Closed on
Sep 1, 2005
Bought by
Radabaugh Linda S Trustee and Linda Sue Radabaugh Rev Trust
Current Estimated Value
Purchase Details
Closed on
Oct 11, 2002
Sold by
Radabaugh Linda S and Radabaugh Jon M
Bought by
Radabaugh Linda S and Linda Sue Radabaugh Revocable
Purchase Details
Closed on
Jun 28, 2000
Sold by
Black Diamond Properties Inc
Bought by
Radabaugh Linda S
Home Financials for this Owner
Home Financials are based on the most recent Mortgage that was taken out on this home.
Original Mortgage
$294,060
Interest Rate
8%
Mortgage Type
Construction
Create a Home Valuation Report for This Property
The Home Valuation Report is an in-depth analysis detailing your home's value as well as a comparison with similar homes in the area
Home Values in the Area
Average Home Value in this Area
Purchase History
| Date | Buyer | Sale Price | Title Company |
|---|---|---|---|
| Radabaugh Linda S Trustee | $100 | -- | |
| Radabaugh Linda S | -- | -- | |
| Radabaugh Linda S | $110,000 | Crystal River Title |
Source: Public Records
Mortgage History
| Date | Status | Borrower | Loan Amount |
|---|---|---|---|
| Previous Owner | Radabaugh Linda S | $294,060 |
Source: Public Records
Tax History
| Year | Tax Paid | Tax Assessment Tax Assessment Total Assessment is a certain percentage of the fair market value that is determined by local assessors to be the total taxable value of land and additions on the property. | Land | Improvement |
|---|---|---|---|---|
| 2025 | $5,848 | $409,750 | $24,000 | $385,750 |
| 2024 | $5,526 | $402,694 | $24,000 | $378,694 |
| 2023 | $5,526 | $392,542 | $22,000 | $370,542 |
| 2022 | $4,768 | $338,045 | $22,000 | $316,045 |
| 2021 | $4,204 | $280,324 | $28,480 | $251,844 |
| 2020 | $4,148 | $278,252 | $28,480 | $249,772 |
| 2019 | $4,022 | $265,796 | $28,480 | $237,316 |
| 2018 | $3,851 | $250,101 | $28,480 | $221,621 |
| 2017 | $3,681 | $233,511 | $28,480 | $205,031 |
| 2016 | $3,727 | $227,509 | $28,480 | $199,029 |
| 2015 | $3,979 | $237,344 | $28,480 | $208,864 |
| 2014 | $4,083 | $235,410 | $54,952 | $180,458 |
Source: Public Records
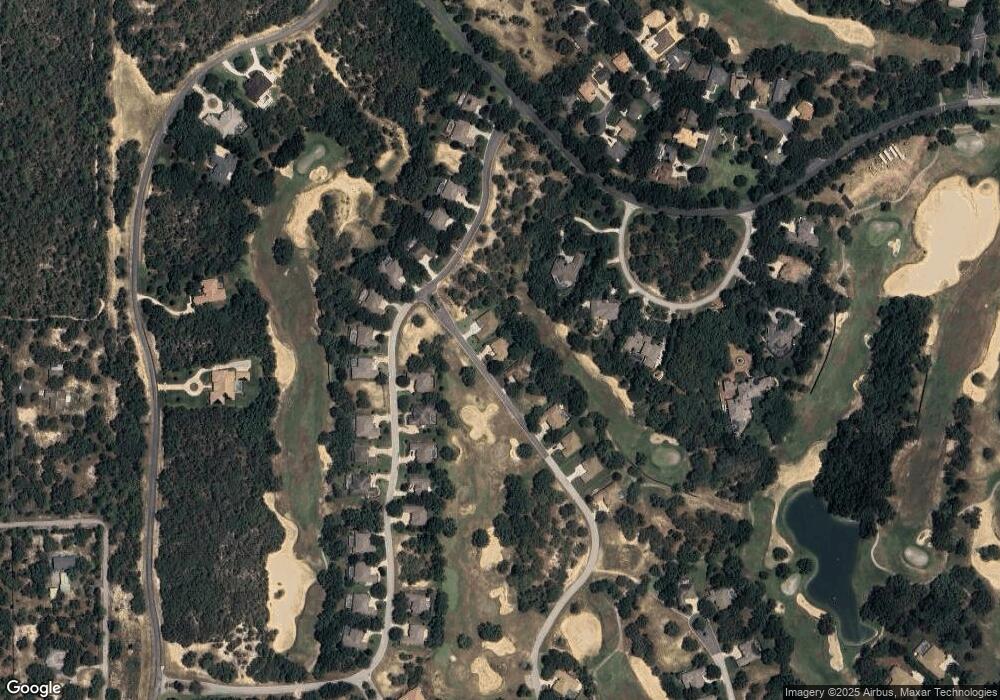
Map
Nearby Homes
- 2815 N Prestwick Way
- 2623 N Prestwick Way
- 3680 W Treyburn Path
- 2618 N Carnoustie Loop
- 2583 N Troon Path
- 2622 N Carnoustie Loop
- 3937 W Shadow Creek Loop
- 2598 N Troon Path
- 2572 N Cross Water Path
- 3178 N Barton Creek Cir
- 3188 N Barton Creek Cir
- 3033 N Caves Valley Path
- 3810 W Crystal Downs Path
- 2788 N Crosswater Path
- 3062 N Barton Creek Cir
- 3135 N Barton Creek Cir
- 2723 N Crosswater Path
- 2852 N Cross Water Path
- 3212 N Caves Valley Path
- 2803 N Crosswater Path
- 2785 N Carnoustie Loop
- 2771 N Carnoustie Loop
- 2763 N Carnoustie Loop
- 2755 N Carnoustie Loop
- 2733 N Prestwick Way
- 3260 W Castle Pines Loop
- 2717 N Prestwick Way
- 3256 W Castle Pines Loop
- 2749 N Carnoustie Loop
- 0 N Prestwick Way
- 30 N Prestwick Way
- 2728 N Prestwick Way
- 15 N Prestwick Way
- 23 N Prestwick Way
- 2802 N Prestwick Way
- 2701 N Prestwick Way
- 29 N Carnoustie Loop
- 26 N Carnoustie Loop
- 0 N Carnoustie Loop
- 14 N Carnoustie Loop
Your Personal Tour Guide
Ask me questions while you tour the home.