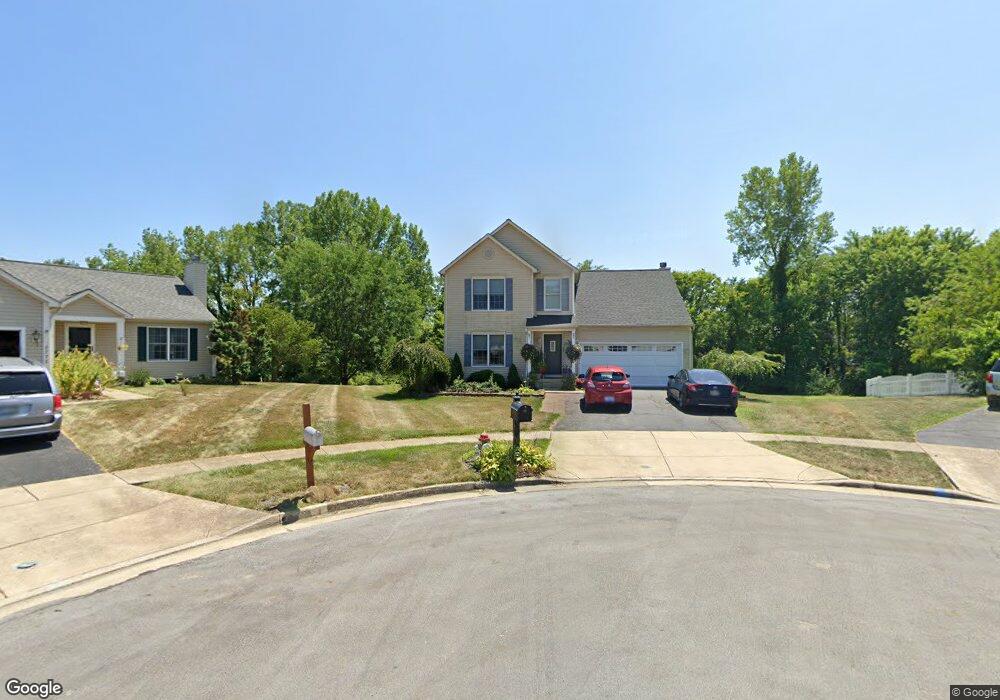
2776 Cross Creek Ave Lancaster, OH 43130
Estimated Value: $341,572 - $359,000
4
Beds
3
Baths
2,218
Sq Ft
$157/Sq Ft
Est. Value
About This Home
This home is located at 2776 Cross Creek Ave, Lancaster, OH 43130 and is currently estimated at $347,143, approximately $156 per square foot. 2776 Cross Creek Ave is a home located in Fairfield County with nearby schools including Tarhe Elementary School, General Sherman Junior High School, and Lancaster High School.
Ownership History
Date
Name
Owned For
Owner Type
Purchase Details
Closed on
Dec 14, 2021
Sold by
Moyer Cynthia K
Bought by
Mcgill Jada K and The Moyer Family Trust
Current Estimated Value
Purchase Details
Closed on
Sep 4, 2007
Sold by
Hud
Bought by
Moyer Cynthia
Home Financials for this Owner
Home Financials are based on the most recent Mortgage that was taken out on this home.
Original Mortgage
$150,000
Outstanding Balance
$95,261
Interest Rate
6.63%
Mortgage Type
Purchase Money Mortgage
Estimated Equity
$251,882
Purchase Details
Closed on
Jan 5, 2007
Sold by
Logan Todd E and Countrywide Home Loans Inc
Bought by
Hud
Purchase Details
Closed on
Aug 28, 2001
Sold by
Dominion Homes Inc
Bought by
Logan Todd E and Logan Damaris K
Home Financials for this Owner
Home Financials are based on the most recent Mortgage that was taken out on this home.
Original Mortgage
$168,820
Interest Rate
7.28%
Mortgage Type
FHA
Create a Home Valuation Report for This Property
The Home Valuation Report is an in-depth analysis detailing your home's value as well as a comparison with similar homes in the area
Home Values in the Area
Average Home Value in this Area
Purchase History
| Date | Buyer | Sale Price | Title Company |
|---|---|---|---|
| Mcgill Jada K | -- | None Available | |
| Moyer Cynthia | $150,000 | Lakeside Title & Escrow Agen | |
| Hud | -- | None Available | |
| Logan Todd E | $170,185 | -- |
Source: Public Records
Mortgage History
| Date | Status | Borrower | Loan Amount |
|---|---|---|---|
| Open | Moyer Cynthia | $150,000 | |
| Previous Owner | Logan Todd E | $168,820 |
Source: Public Records
Tax History Compared to Growth
Tax History
| Year | Tax Paid | Tax Assessment Tax Assessment Total Assessment is a certain percentage of the fair market value that is determined by local assessors to be the total taxable value of land and additions on the property. | Land | Improvement |
|---|---|---|---|---|
| 2024 | $6,845 | $76,140 | $11,400 | $64,740 |
| 2023 | $2,769 | $76,140 | $11,400 | $64,740 |
| 2022 | $2,780 | $76,140 | $11,400 | $64,740 |
| 2021 | $2,273 | $58,310 | $10,360 | $47,950 |
| 2020 | $2,178 | $58,310 | $10,360 | $47,950 |
| 2019 | $2,070 | $58,310 | $10,360 | $47,950 |
| 2018 | $1,920 | $52,380 | $10,360 | $42,020 |
| 2017 | $1,921 | $51,370 | $9,350 | $42,020 |
| 2016 | $1,871 | $51,370 | $9,350 | $42,020 |
| 2015 | $1,857 | $49,490 | $9,350 | $40,140 |
| 2014 | $1,769 | $49,490 | $9,350 | $40,140 |
| 2013 | $1,769 | $49,490 | $9,350 | $40,140 |
Source: Public Records
Map
Nearby Homes
- 1715 Tecumseh Dr
- 1889 Salt Lick Dr
- 1639 Tecumseh Dr
- 1638 Quail Meadows Dr
- 2387 Zachariah Ave
- 2422 Long Bow Ave
- 2445 Columbus Lancaster Rd NW Unit Lot 176
- 2445 Columbus Lancaster Rd NW Unit Lot 408 Walnut St
- 2445 Columbus Lancaster Rd NW Unit lot 463
- 1632 Bush Hill Dr
- 2195 Olde Ridge Ct
- 3355 Old Columbus Rd NW
- 218 Marvel Dr
- 2610 Misty Meadows Ave
- 260 Scott Dr
- 282 14th St
- 2482 Brook Run Dr
- 340 16th St
- 1917 Nichole Cir
- 331 16th St
- 2772 Cross Creek Ave
- 2779 Cross Creek Ave
- 2775 Cross Creek Ave
- 2766 Cross Creek Ave
- 2771 Cross Creek Ave
- 2684 Two Ridge Ave
- 2765 Cross Creek Ave
- 2678 Two Ridge Ave
- 2705 Fernwood Ave
- 2672 Two Ridge Ave
- 2759 Cross Creek Ave
- 2711 Fernwood Ave
- 2699 Fernwood Ave
- 2715 Fernwood Ave
- 2693 Fernwood Ave
- 2695 Two Ridge Ave
- 2691 Two Ridge Ave
- 2685 Fernwood Ave
- 2664 Two Ridge Ave
- 2753 Cross Creek Ave