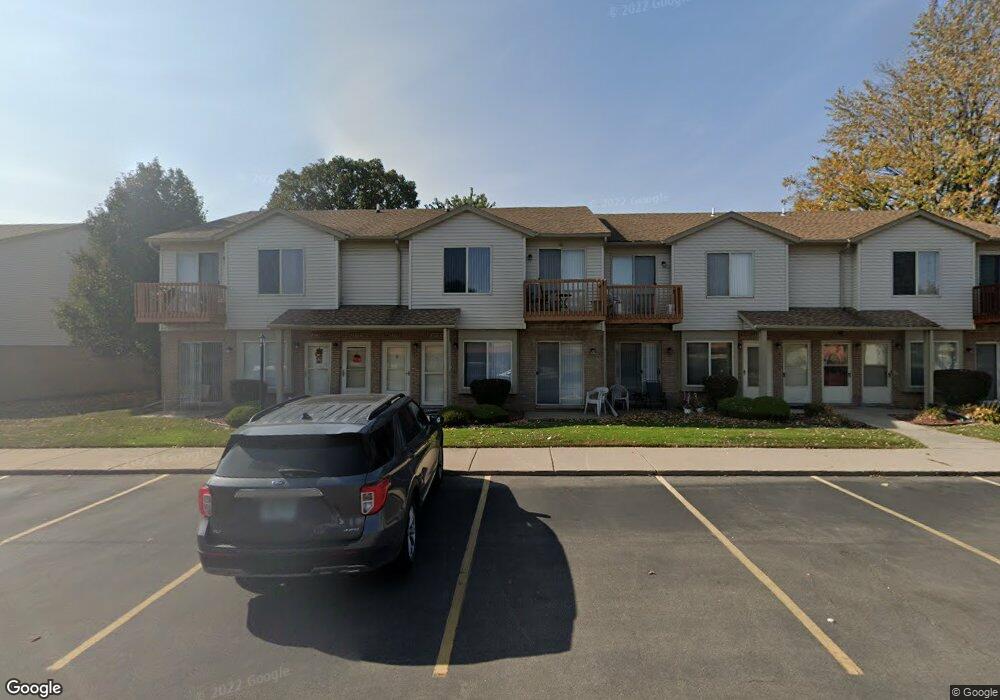
27789 Carini Villa St Unit 5 Roseville, MI 48066
Estimated Value: $78,525 - $96,000
2
Beds
1
Bath
803
Sq Ft
$107/Sq Ft
Est. Value
About This Home
This home is located at 27789 Carini Villa St Unit 5, Roseville, MI 48066 and is currently estimated at $85,881, approximately $106 per square foot. 27789 Carini Villa St Unit 5 is a home located in Macomb County with nearby schools including Joseph G. Steenland Elementary School, Fountain Elementary School, and Dort Elementary School.
Ownership History
Date
Name
Owned For
Owner Type
Purchase Details
Closed on
May 12, 2016
Sold by
Jones Ronald and Jones Valerie
Bought by
Shamoon Investments Llc
Current Estimated Value
Purchase Details
Closed on
Jun 22, 2010
Sold by
Donovan Shaun
Bought by
Jones Ronald
Purchase Details
Closed on
Jan 21, 2010
Sold by
Bac Home Loans Servicing Lp
Bought by
The Secretary Of Housing & Urban Develop
Purchase Details
Closed on
Jul 17, 2009
Sold by
Klein Mark T
Bought by
Bac Home Loans Servicing Lp and Countrywide Home Loans Servicing Lp
Purchase Details
Closed on
Oct 18, 2004
Sold by
Ouellette Judith M and Ouellette William J
Bought by
Klein Mark T
Home Financials for this Owner
Home Financials are based on the most recent Mortgage that was taken out on this home.
Original Mortgage
$80,155
Interest Rate
5.85%
Mortgage Type
FHA
Create a Home Valuation Report for This Property
The Home Valuation Report is an in-depth analysis detailing your home's value as well as a comparison with similar homes in the area
Home Values in the Area
Average Home Value in this Area
Purchase History
| Date | Buyer | Sale Price | Title Company |
|---|---|---|---|
| Shamoon Investments Llc | $42,250 | Greater Macomb Title Agency | |
| Shamoon Investments Llc | -- | Greater Macomb Title Agency | |
| Jones Ronald | $20,000 | None Available | |
| The Secretary Of Housing & Urban Develop | -- | None Available | |
| Bac Home Loans Servicing Lp | $81,741 | None Available | |
| Klein Mark T | $82,000 | Great Lakes Title Of Mi |
Source: Public Records
Mortgage History
| Date | Status | Borrower | Loan Amount |
|---|---|---|---|
| Previous Owner | Klein Mark T | $80,155 |
Source: Public Records
Tax History Compared to Growth
Tax History
| Year | Tax Paid | Tax Assessment Tax Assessment Total Assessment is a certain percentage of the fair market value that is determined by local assessors to be the total taxable value of land and additions on the property. | Land | Improvement |
|---|---|---|---|---|
| 2025 | $1,978 | $35,700 | $0 | $0 |
| 2024 | $1,036 | $34,900 | $0 | $0 |
| 2023 | $992 | $33,100 | $0 | $0 |
| 2022 | $1,774 | $30,300 | $0 | $0 |
| 2021 | $1,721 | $28,300 | $0 | $0 |
| 2020 | $951 | $24,300 | $0 | $0 |
| 2019 | $1,547 | $22,300 | $0 | $0 |
| 2018 | $1,516 | $0 | $0 | $0 |
| 2017 | $1,433 | $19,293 | $3,300 | $15,993 |
| 2016 | $1,122 | $19,293 | $0 | $0 |
| 2015 | $678 | $16,663 | $0 | $0 |
| 2013 | -- | $15,949 | $0 | $0 |
| 2011 | -- | $20,478 | $0 | $0 |
Source: Public Records
Map
Nearby Homes
- 27241 Woodmont St
- 16067 Secretariat Ave
- 27130 Woodmont St
- 27100 Woodmont St
- 28633 Citation Dr
- 26750 Belanger St
- 15238 Troy St
- 15251 Wildwood St
- 26700 Belanger St
- 26621 Kathy St
- 27155 Blum St
- 29101 Hayes Rd
- 26584 Kathy St
- 26730 Ridgemont St
- 15329 Petrie St
- 29201 Hayes Rd Unit G8
- 29249 Hayes #74 Rd Unit 74
- 26620 Academy St
- 29273 Rd
- 15214 Petrie St
- 27783 Carini Villa St
- 27787 Carini Villa St
- 27799 Carini Villa St Unit 1
- 27793 Carini Villa St Unit 3
- 27785 Carini Villa St
- 27797 Carini Villa St
- 27797 Carini Villa St Unit 2
- 27767 Carini
- 27779 Carini Villa St
- 27765 Carini Villa St
- 27763 Carini Villa St Unit 15
- 27767 Carini Villa St Unit 14
- 27769 Carini Villa St
- 27775 Carini Villa St
- 27773 Carini Villa St
- 27777 Carini Villa St Unit 10
- 15738 Orchard Ln
- 15738 Orchard Ln Unit 15738 Orchard
- 27755 Carini Villa St Unit 20
- 27753 Carini Villa St Unit 19