Estimated Value: $148,000 - $208,000
2
Beds
1
Bath
1,107
Sq Ft
$157/Sq Ft
Est. Value
About This Home
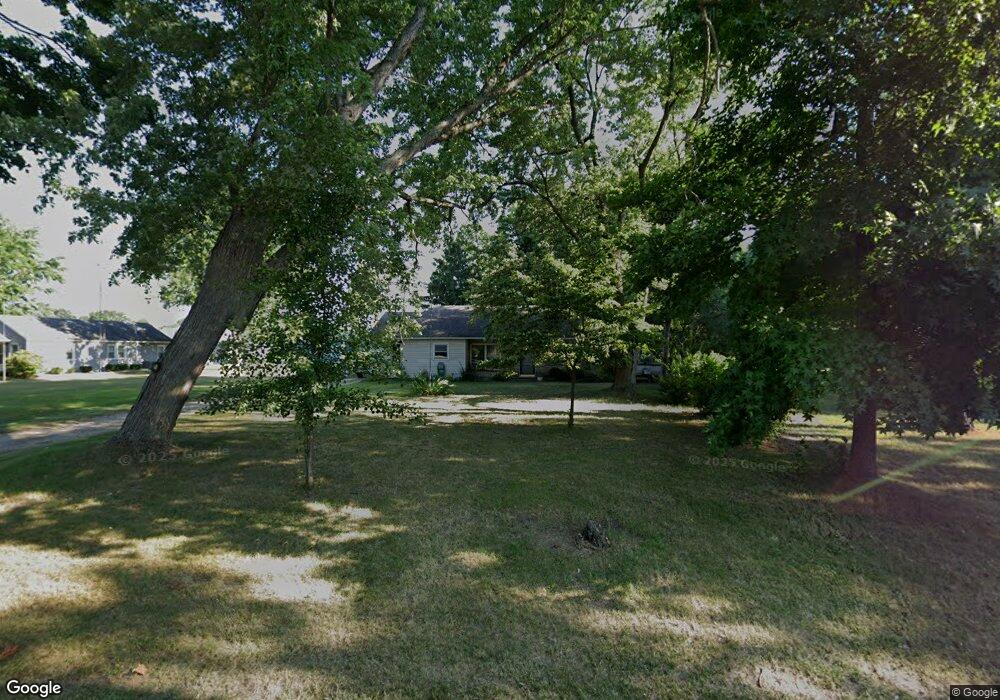
This home is located at 2779 Mannix St, Niles, MI 49120 and is currently estimated at $174,034, approximately $157 per square foot. 2779 Mannix St is a home located in Cass County with nearby schools including Howard-Ellis Elementary School, James Ellis School, and Oak Manor Sixth Grade Center.
Ownership History
Date
Name
Owned For
Owner Type
Purchase Details
Closed on
May 14, 2007
Sold by
Fitzgerald Michael S
Bought by
Purucker Michael and Frucci Maria
Current Estimated Value
Home Financials for this Owner
Home Financials are based on the most recent Mortgage that was taken out on this home.
Original Mortgage
$96,485
Outstanding Balance
$58,817
Interest Rate
6.21%
Estimated Equity
$115,217
Purchase Details
Closed on
Apr 30, 2004
Sold by
Wilson Mark A and Wilson Michele
Bought by
Fitzgerald Michael S
Home Financials for this Owner
Home Financials are based on the most recent Mortgage that was taken out on this home.
Original Mortgage
$78,000
Interest Rate
5.5%
Create a Home Valuation Report for This Property
The Home Valuation Report is an in-depth analysis detailing your home's value as well as a comparison with similar homes in the area
Home Values in the Area
Average Home Value in this Area
Purchase History
| Date | Buyer | Sale Price | Title Company |
|---|---|---|---|
| Purucker Michael | $98,000 | None Available | |
| Fitzgerald Michael S | $83,000 | Meridian Title Corp |
Source: Public Records
Mortgage History
| Date | Status | Borrower | Loan Amount |
|---|---|---|---|
| Open | Purucker Michael | $96,485 | |
| Previous Owner | Fitzgerald Michael S | $78,000 |
Source: Public Records
Tax History
| Year | Tax Paid | Tax Assessment Tax Assessment Total Assessment is a certain percentage of the fair market value that is determined by local assessors to be the total taxable value of land and additions on the property. | Land | Improvement |
|---|---|---|---|---|
| 2025 | $1,034 | $45,700 | $45,700 | $0 |
| 2024 | $410 | $45,200 | $45,200 | $0 |
| 2023 | $391 | $37,500 | $0 | $0 |
| 2022 | $372 | $40,700 | $0 | $0 |
| 2021 | $845 | $39,900 | $0 | $0 |
| 2020 | $836 | $38,900 | $0 | $0 |
| 2019 | $806 | $37,900 | $0 | $0 |
| 2018 | $343 | $34,800 | $0 | $0 |
| 2017 | $336 | $32,600 | $0 | $0 |
| 2016 | $333 | $31,466 | $0 | $0 |
| 2015 | -- | $31,600 | $0 | $0 |
| 2011 | -- | $32,600 | $0 | $0 |
Source: Public Records
Map
Nearby Homes
- 2726 Horton Ct
- 2671 Mulberry St
- 1403 Barron Lake Rd
- 2963 Detroit Rd
- 2582 Bartak St
- 2955 Hoyt St
- 2561 Lake Shore Dr
- 2529 Lake Shore Dr
- 1002 Leet Rd
- 1718 Barron Lake Rd
- 2419 Blanchard Dr
- 0 Lake St Unit 25037542
- 1115 Marshlyn Dr
- 2354 Yankee St
- 2314 Hand Rd
- 1872 Barron Lake Rd
- 2298 Yankee St
- 1943 Terminal Rd
Your Personal Tour Guide
Ask me questions while you tour the home.