Estimated Value: $647,000 - $697,000
5
Beds
3
Baths
3,231
Sq Ft
$208/Sq Ft
Est. Value
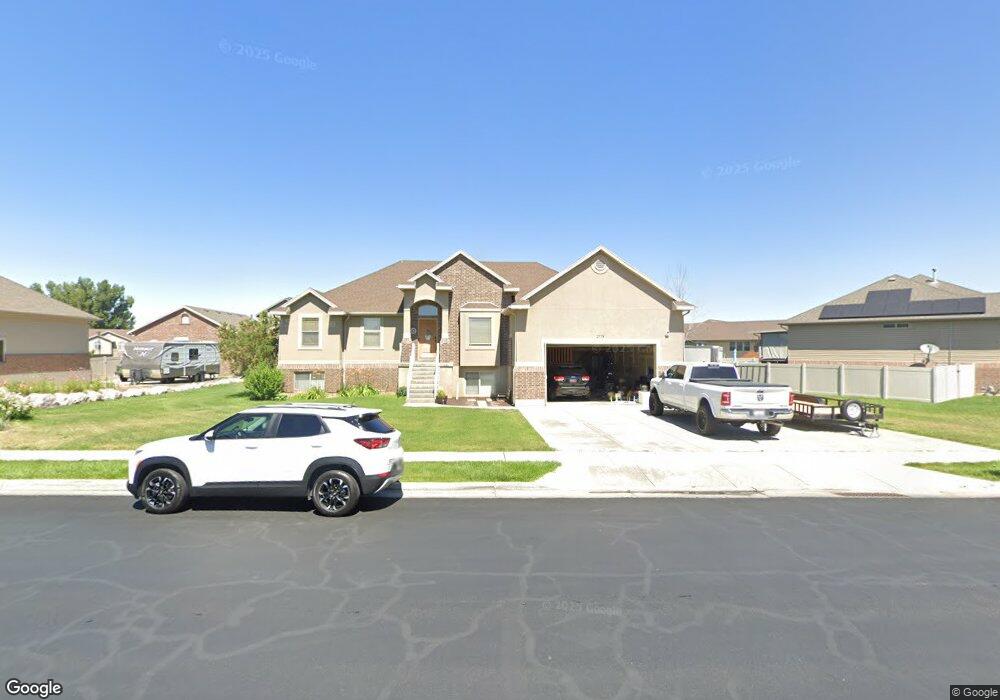
About This Home
This home is located at 2779 N 2575 W, Ogden, UT 84404 and is currently estimated at $670,762, approximately $207 per square foot. 2779 N 2575 W is a home located in Weber County with nearby schools including Farr West Elementary School, Wahlquist Junior High School, and Fremont High School.
Ownership History
Date
Name
Owned For
Owner Type
Purchase Details
Closed on
Jul 25, 2017
Sold by
Smedley Talmage D and Smedley Jelaire
Bought by
Poulsen Roy and Poulsen Annette
Current Estimated Value
Home Financials for this Owner
Home Financials are based on the most recent Mortgage that was taken out on this home.
Original Mortgage
$331,930
Outstanding Balance
$221,530
Interest Rate
3.91%
Mortgage Type
New Conventional
Estimated Equity
$449,232
Purchase Details
Closed on
Apr 18, 2007
Sold by
Legend Construction Llc
Bought by
Brown Travis F and Brown Wendy B
Create a Home Valuation Report for This Property
The Home Valuation Report is an in-depth analysis detailing your home's value as well as a comparison with similar homes in the area
Home Values in the Area
Average Home Value in this Area
Purchase History
| Date | Buyer | Sale Price | Title Company |
|---|---|---|---|
| Poulsen Roy | -- | Mountain View Title | |
| Brown Travis F | -- | Mountain View Title Ogden |
Source: Public Records
Mortgage History
| Date | Status | Borrower | Loan Amount |
|---|---|---|---|
| Open | Poulsen Roy | $331,930 |
Source: Public Records
Tax History
| Year | Tax Paid | Tax Assessment Tax Assessment Total Assessment is a certain percentage of the fair market value that is determined by local assessors to be the total taxable value of land and additions on the property. | Land | Improvement |
|---|---|---|---|---|
| 2025 | $4,070 | $640,281 | $180,506 | $459,775 |
| 2024 | $3,973 | $350,899 | $99,278 | $251,621 |
| 2023 | $3,860 | $339,350 | $99,031 | $240,319 |
| 2022 | $3,670 | $331,100 | $88,221 | $242,879 |
| 2021 | $3,136 | $471,000 | $105,326 | $365,674 |
| 2020 | $3,021 | $415,000 | $95,265 | $319,735 |
| 2019 | $2,999 | $389,000 | $75,170 | $313,830 |
| 2018 | $2,993 | $372,000 | $75,170 | $296,830 |
| 2017 | $2,879 | $346,000 | $75,234 | $270,766 |
| 2016 | $2,376 | $157,962 | $38,573 | $119,389 |
| 2015 | $2,280 | $142,120 | $38,573 | $103,547 |
| 2014 | $1,980 | $117,691 | $27,650 | $90,041 |
Source: Public Records
Map
Nearby Homes
- 2581 W 2825 N
- 2442 W 2850 N
- 2519 W 2950 N
- 2524 W 2950 N
- 2440 W 2900 N
- 2427 W 2950 N Unit 100
- 2910 N Galloway Ln Unit 266
- 2452 W 2950 N
- 2452 W 2950 N Unit 112
- 2409 W 2950 N
- 2409 W 2950 N Unit 101
- 2810 W Guernsey Ln Unit 222
- 2821 W 2705 N Unit 91
- 2831 W 2720 N Unit 73
- 2508 W 3000 N
- 2834 W 2720 N Unit 78
- 2837 W 2720 N Unit 74
- 2838 W 2705 N Unit 71
- 2847 W 2720 N Unit 75
- 2830 W Guernsey Ln Unit 219
- 2801 N 2575 W
- 2801 N 2575 W Unit 57
- 2771 N 2575 W
- 2771 N 2575 W Unit 55
- 2794 N 2600 W
- 2762 N 2575 W
- 2766 N 2600 W
- 2766 N 2600 W Unit 54
- 2595 W 2825 N
- 2776 N 2525 W
- 2776 N 2525 W Unit 65
- 2581 W 2825 N Unit 75
- 2613 W 2825 N
- 2757 N 2525 W Unit 64
- 2757 N 2525 W
- 2544 W 2800 N Unit 58
- 2544 W 2800 N
- 0 Villas at Jdc Ranch St Unit 36440062
- 2742 N 2575 W
- 2742 N 2575 W Unit 67
Your Personal Tour Guide
Ask me questions while you tour the home.