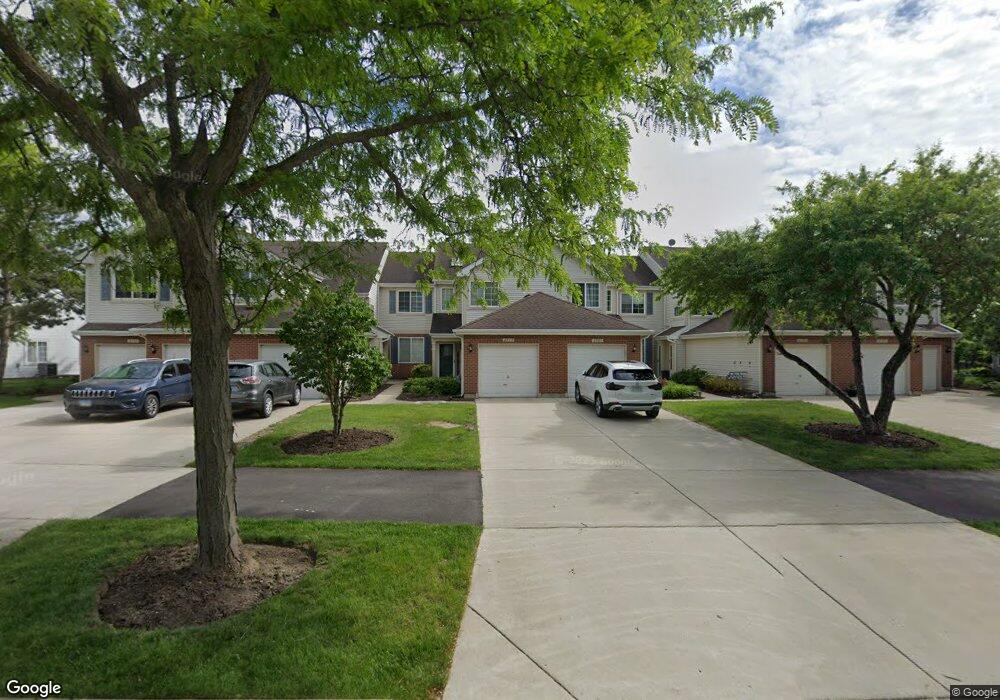
2779 Odlum Dr Unit 132779 Schaumburg, IL 60194
West Schaumburg NeighborhoodEstimated Value: $268,761 - $312,000
2
Beds
--
Bath
1,100
Sq Ft
$273/Sq Ft
Est. Value
About This Home
This home is located at 2779 Odlum Dr Unit 132779, Schaumburg, IL 60194 and is currently estimated at $300,440, approximately $273 per square foot. 2779 Odlum Dr Unit 132779 is a home located in Cook County with nearby schools including Glenbrook Elementary School, Canton Middle School, and Streamwood High School.
Ownership History
Date
Name
Owned For
Owner Type
Purchase Details
Closed on
Jan 23, 2023
Sold by
Hyman Michelle H
Bought by
Michelle H Hyman Living Trust and Hyman
Current Estimated Value
Purchase Details
Closed on
Jan 15, 2001
Sold by
Bak Thomas E and Bak Leslie D
Bought by
Hyman Michelle H
Home Financials for this Owner
Home Financials are based on the most recent Mortgage that was taken out on this home.
Original Mortgage
$124,000
Interest Rate
7.58%
Purchase Details
Closed on
Jul 14, 1995
Sold by
Bak Thomas K and Bak Leslie D
Bought by
Bak Thomas K and Bak Leslie D
Purchase Details
Closed on
Dec 20, 1994
Sold by
Pinnacle Corp
Bought by
Bak Thomas K and Bak Leslie D
Home Financials for this Owner
Home Financials are based on the most recent Mortgage that was taken out on this home.
Original Mortgage
$95,300
Interest Rate
9.19%
Create a Home Valuation Report for This Property
The Home Valuation Report is an in-depth analysis detailing your home's value as well as a comparison with similar homes in the area
Home Values in the Area
Average Home Value in this Area
Purchase History
| Date | Buyer | Sale Price | Title Company |
|---|---|---|---|
| Michelle H Hyman Living Trust | -- | None Listed On Document | |
| Hyman Michelle H | $155,000 | -- | |
| Bak Thomas K | -- | -- | |
| Bak Thomas K | $119,500 | -- |
Source: Public Records
Mortgage History
| Date | Status | Borrower | Loan Amount |
|---|---|---|---|
| Previous Owner | Hyman Michelle H | $124,000 | |
| Previous Owner | Bak Thomas K | $95,300 |
Source: Public Records
Tax History Compared to Growth
Tax History
| Year | Tax Paid | Tax Assessment Tax Assessment Total Assessment is a certain percentage of the fair market value that is determined by local assessors to be the total taxable value of land and additions on the property. | Land | Improvement |
|---|---|---|---|---|
| 2024 | $4,599 | $19,647 | $2,606 | $17,041 |
| 2023 | $4,465 | $19,647 | $2,606 | $17,041 |
| 2022 | $4,465 | $19,647 | $2,606 | $17,041 |
| 2021 | $4,143 | $15,924 | $3,175 | $12,749 |
| 2020 | $4,168 | $15,924 | $3,175 | $12,749 |
| 2019 | $4,201 | $17,857 | $3,175 | $14,682 |
| 2018 | $3,956 | $15,723 | $2,768 | $12,955 |
| 2017 | $3,944 | $15,723 | $2,768 | $12,955 |
| 2016 | $3,960 | $15,723 | $2,768 | $12,955 |
| 2015 | $4,374 | $15,983 | $2,443 | $13,540 |
| 2014 | $4,339 | $15,983 | $2,443 | $13,540 |
| 2013 | $4,194 | $15,983 | $2,443 | $13,540 |
Source: Public Records
Map
Nearby Homes
- 368 Glen Byrn Ct Unit 11368A
- 2741 Odlum Dr Unit 3
- 247 Camel Bend Ct Unit 37247
- 239 Camel Bend Ct Unit 36239
- 226 Sierra Pass Dr Unit 62262
- 217 Sierra Pass Dr Unit 28217
- 171 Sierra Pass Dr Unit 261713
- 2933 Heatherwood Dr Unit 1915
- 2 Oakmont Ct
- 198 Camden Ct Unit Z2
- 208 Judy Ln
- 62 Beechmont Ct Unit C
- 1968 Quaker Hollow Ln Unit 12
- 216 Whitewood Dr Unit 5
- 2868 Belle Ln Unit 143B28
- 1924 Quaker Hollow Ln Unit 14
- 1916 Quaker Hollow Ln Unit 14
- 195 Island Ct
- 2902 Belle Ln
- 133 White Branch Ct S Unit 539
- 2787 Odlum Dr Unit 132787
- 2787 Odlum Dr Unit 3
- 2773 Odlum Dr Unit 132773
- 2781 Odlum Dr Unit 132781
- 2781 Odlum Dr Unit 2
- 2777 Odlum Dr Unit 132777
- 2783 Odlum Dr Unit 132783
- 2783 Odlum Dr Unit 4
- 2775 Odlum Dr Unit 132775
- 2785 Odlum Dr Unit 132785
- 2785 Odlum Dr Unit 1
- 297 Camel Bend Ct Unit 40297
- 297 Camel Bend Ct Unit 40-1
- 295 Camel Bend Ct Unit 40295
- 273 Sierra Pass Dr Unit 39-3
- 293 Camel Bend Ct Unit 40293
- 299 Camel Bend Ct Unit 40299
- 291 Camel Bend Ct Unit 2
- 291 Camel Bend Ct Unit 40291
- 289 Camel Bend Ct Unit 40289