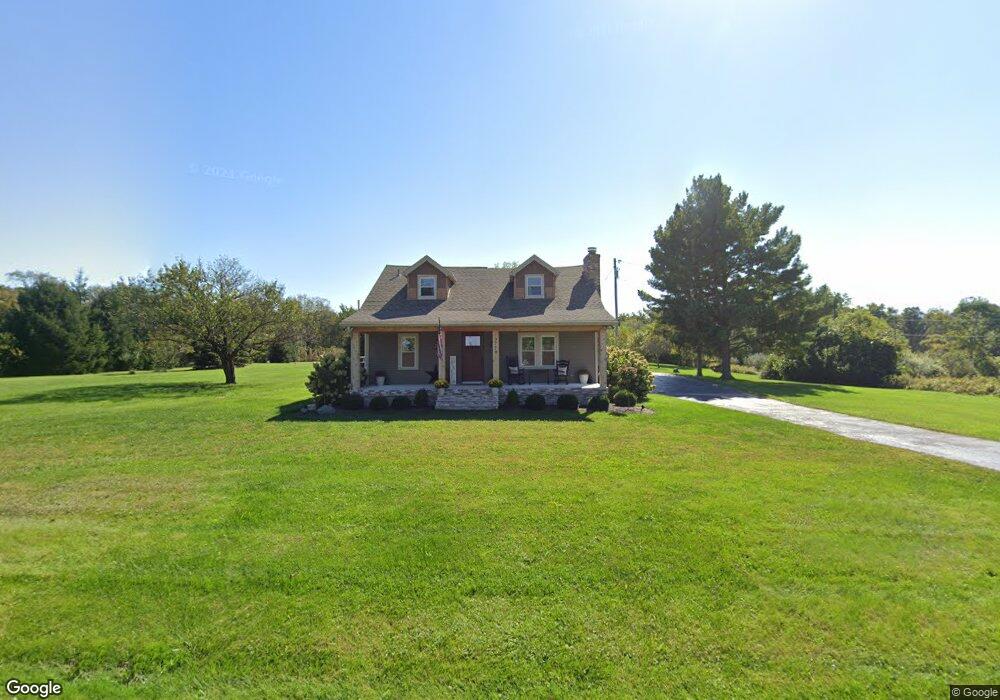
2779 Sears Rd Spring Valley, OH 45370
Estimated Value: $333,000 - $515,770
4
Beds
3
Baths
1,862
Sq Ft
$218/Sq Ft
Est. Value
About This Home
This home is located at 2779 Sears Rd, Spring Valley, OH 45370 and is currently estimated at $405,193, approximately $217 per square foot. 2779 Sears Rd is a home located in Greene County with nearby schools including Xenia High School.
Ownership History
Date
Name
Owned For
Owner Type
Purchase Details
Closed on
Sep 15, 2009
Sold by
Decker William J and Decker Judith A
Bought by
Gregory Ryan P and Gregory Lee B
Current Estimated Value
Home Financials for this Owner
Home Financials are based on the most recent Mortgage that was taken out on this home.
Original Mortgage
$206,400
Outstanding Balance
$135,873
Interest Rate
5.32%
Mortgage Type
New Conventional
Estimated Equity
$269,320
Purchase Details
Closed on
Sep 21, 2005
Sold by
Decker William J and Decker Judith A
Bought by
Wical Gary W and Wical Nelle E
Home Financials for this Owner
Home Financials are based on the most recent Mortgage that was taken out on this home.
Original Mortgage
$90,000
Interest Rate
6.01%
Mortgage Type
Unknown
Purchase Details
Closed on
Apr 24, 2000
Sold by
Dorworth Gordon L and Dorworth Kanoko
Bought by
Decker William J and Decker Judith A
Home Financials for this Owner
Home Financials are based on the most recent Mortgage that was taken out on this home.
Original Mortgage
$200,000
Interest Rate
7.25%
Create a Home Valuation Report for This Property
The Home Valuation Report is an in-depth analysis detailing your home's value as well as a comparison with similar homes in the area
Purchase History
| Date | Buyer | Sale Price | Title Company |
|---|---|---|---|
| Gregory Ryan P | $258,000 | Attorney | |
| Wical Gary W | $120,000 | -- | |
| Decker William J | $266,000 | -- |
Source: Public Records
Mortgage History
| Date | Status | Borrower | Loan Amount |
|---|---|---|---|
| Open | Gregory Ryan P | $206,400 | |
| Previous Owner | Wical Gary W | $90,000 | |
| Previous Owner | Decker William J | $200,000 |
Source: Public Records
Tax History
| Year | Tax Paid | Tax Assessment Tax Assessment Total Assessment is a certain percentage of the fair market value that is determined by local assessors to be the total taxable value of land and additions on the property. | Land | Improvement |
|---|---|---|---|---|
| 2024 | $6,324 | $125,020 | $54,510 | $70,510 |
| 2023 | $6,273 | $125,020 | $54,510 | $70,510 |
| 2022 | $5,981 | $102,870 | $51,100 | $51,770 |
| 2021 | $6,053 | $102,870 | $51,100 | $51,770 |
| 2020 | $5,549 | $102,870 | $51,100 | $51,770 |
| 2019 | $4,977 | $86,470 | $42,710 | $43,760 |
| 2018 | $4,908 | $86,470 | $42,710 | $43,760 |
| 2017 | $4,658 | $86,470 | $42,710 | $43,760 |
| 2016 | $4,659 | $83,810 | $42,010 | $41,800 |
| 2015 | $4,671 | $83,810 | $42,010 | $41,800 |
| 2014 | $4,482 | $83,810 | $42,010 | $41,800 |
Source: Public Records
Map
Nearby Homes
- 0 Penewit Rd
- Lot 1 - 3708 Penewit Rd
- 10 Acres Penewit Rd
- 2 Acres Mount Holly Rd
- Lot 2 Mount Holly Rd
- 0 Mount Holly Rd
- 8881 Route 42
- 9500 Collett Rd Unit 20
- 2763 Ferry Rd
- 8308 Cedar Hill Rd
- 196 Mound St
- 3761 Ferry Rd
- 2644 Center Creek Cir
- 2471 Lower Bellbrook Rd
- 4135 E Social Row Rd
- 4290 Laura Marie Dr
- 1667 Ardennes Oak Dr
- 45 N East St Unit 45
- 2415 Tennyson Dr
- 3110 Beech Hill Dr
- 2759 Sears Rd
- 2915 Sears Rd
- 2939 Sears Rd
- 2971 Sears Rd
- 3576 Penewit Rd
- 3640 Old Stage Rd
- 3460 Penewit Rd
- 3545 Penewit Rd
- 3001 Sears Rd
- 3561 Penewit Rd
- 3577 Penewit Rd
- 3595 Penewit Rd
- 3615 Penewit Rd
- 3036 Sears Rd
- 3032 Sears Rd
- 3029 Sears Rd
- 3461 Penewit Rd
- 3415 Penewit Rd
- 3653 Penewit Rd
- 3045 Sears Rd
Your Personal Tour Guide
Ask me questions while you tour the home.