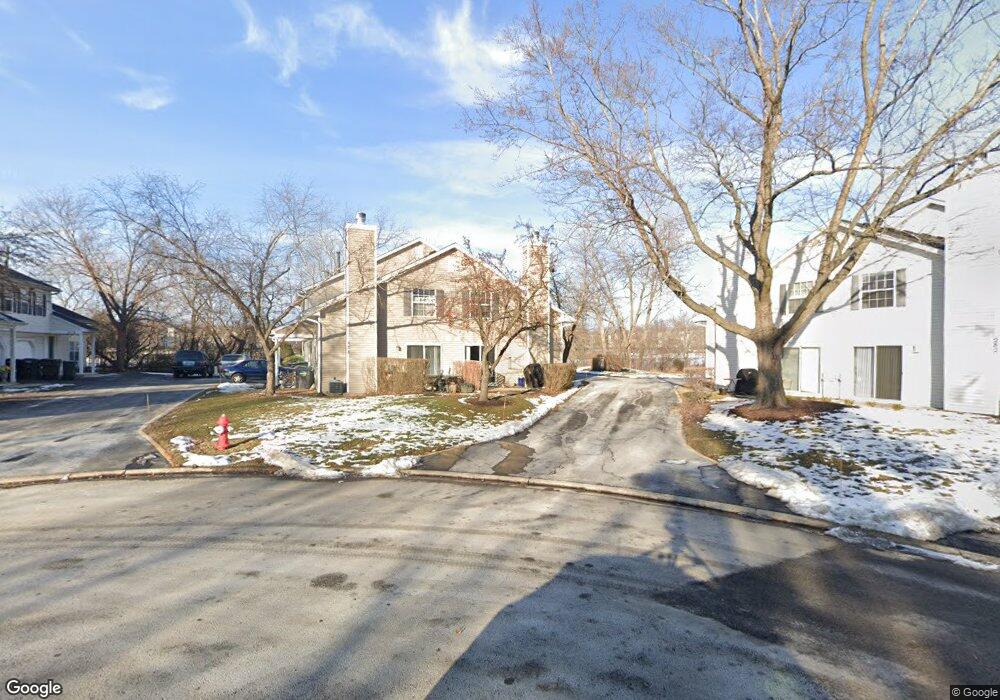
278 Butternut Ln Unit 3A Streamwood, IL 60107
Estimated Value: $256,000 - $275,158
2
Beds
2
Baths
1,350
Sq Ft
$195/Sq Ft
Est. Value
About This Home
This home is located at 278 Butternut Ln Unit 3A, Streamwood, IL 60107 and is currently estimated at $263,540, approximately $195 per square foot. 278 Butternut Ln Unit 3A is a home located in Cook County with nearby schools including Ridge Circle Elementary School, Canton Middle School, and Streamwood High School.
Ownership History
Date
Name
Owned For
Owner Type
Purchase Details
Closed on
Dec 12, 2016
Sold by
Ultimate Rental Investments Llc
Bought by
Pulgarin Felipe E
Current Estimated Value
Home Financials for this Owner
Home Financials are based on the most recent Mortgage that was taken out on this home.
Original Mortgage
$104,000
Interest Rate
10%
Mortgage Type
Construction
Purchase Details
Closed on
Nov 18, 2016
Sold by
Schfaer
Bought by
Ultimate Rental Investments Llc
Home Financials for this Owner
Home Financials are based on the most recent Mortgage that was taken out on this home.
Original Mortgage
$104,000
Interest Rate
10%
Mortgage Type
Construction
Purchase Details
Closed on
Feb 28, 2005
Sold by
The Southgate Manors Ltd
Bought by
Newton Brian R and Schafer Jennifer L
Home Financials for this Owner
Home Financials are based on the most recent Mortgage that was taken out on this home.
Original Mortgage
$179,096
Interest Rate
5.7%
Mortgage Type
FHA
Create a Home Valuation Report for This Property
The Home Valuation Report is an in-depth analysis detailing your home's value as well as a comparison with similar homes in the area
Home Values in the Area
Average Home Value in this Area
Purchase History
| Date | Buyer | Sale Price | Title Company |
|---|---|---|---|
| Pulgarin Felipe E | -- | None Available | |
| Ultimate Rental Investments Llc | $97,000 | None Available | |
| Newton Brian R | $182,000 | Multiple |
Source: Public Records
Mortgage History
| Date | Status | Borrower | Loan Amount |
|---|---|---|---|
| Closed | Ultimate Rental Investments Llc | $104,000 | |
| Previous Owner | Newton Brian R | $179,096 |
Source: Public Records
Tax History Compared to Growth
Tax History
| Year | Tax Paid | Tax Assessment Tax Assessment Total Assessment is a certain percentage of the fair market value that is determined by local assessors to be the total taxable value of land and additions on the property. | Land | Improvement |
|---|---|---|---|---|
| 2024 | $5,236 | $17,000 | $3,500 | $13,500 |
| 2023 | $5,099 | $17,000 | $3,500 | $13,500 |
| 2022 | $5,099 | $17,000 | $3,500 | $13,500 |
| 2021 | $4,701 | $12,860 | $4,483 | $8,377 |
| 2020 | $4,622 | $12,860 | $4,483 | $8,377 |
| 2019 | $4,617 | $14,450 | $4,483 | $9,967 |
| 2018 | $4,429 | $12,575 | $3,908 | $8,667 |
| 2017 | $4,368 | $12,575 | $3,908 | $8,667 |
| 2016 | $4,073 | $12,575 | $3,908 | $8,667 |
| 2015 | $4,189 | $11,811 | $3,448 | $8,363 |
| 2014 | $4,126 | $11,811 | $3,448 | $8,363 |
| 2013 | $3,998 | $11,811 | $3,448 | $8,363 |
Source: Public Records
Map
Nearby Homes
- 195 Island Ct
- 2902 Belle Ln
- 2868 Belle Ln Unit 143B28
- 2814 Belle Ln Unit 128A28
- 1 Aspen Ct
- 515 Southwood Cir
- 8 Aspen Ct
- 200 Columbia Ct Unit 5
- 171 Sierra Pass Dr Unit 261713
- 202 Parkwood Dr
- 324 Juniper Cir
- 226 Sierra Pass Dr Unit 62262
- 272 Juniper Cir
- 707 Sunset Cir
- 239 Camel Bend Ct Unit 36239
- 247 Camel Bend Ct Unit 37247
- 206 Ridge Cir
- 125 Seton Place
- 2404 Baldwin Ct
- 27 Ridge Cir
- 274 Butternut Ln Unit 3A
- 276 Butternut Ln Unit 3A
- 280 Butternut Ln
- 272 Butternut Ln Unit 3A
- 284 Butternut Ln Unit 3A
- 282 Butternut Ln
- 266 Butternut Ln
- 286 Butternut Ln
- 268 Butternut Ln
- 268 Butternut Ln Unit 268
- 264 Butternut Ln Unit 3A
- 283 Butternut Ln
- 287 Butternut Ln
- 262 Butternut Ln
- 281 Butternut Ln
- 285 Butternut Ln Unit 3A
- 275 Butternut Ln
- 260 Butternut Ln
- 273 Butternut Ln
- 256 Butternut Ln Unit 3A