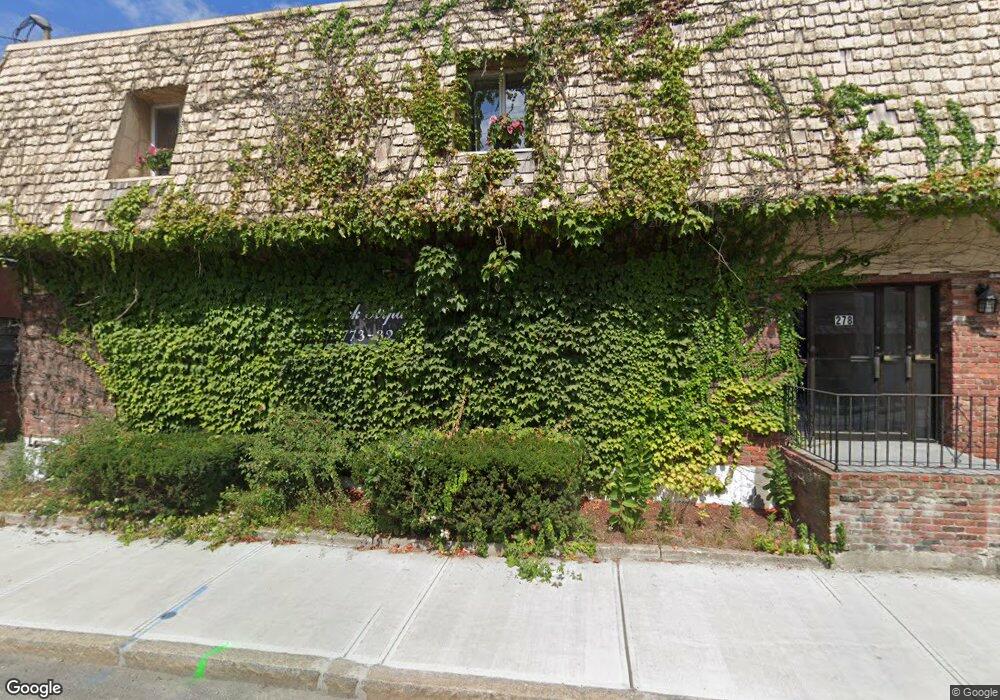
278 Centre St Unit 2 Quincy, MA 02169
South Quincy NeighborhoodEstimated Value: $1,054,884
--
Bed
2
Baths
3,244
Sq Ft
$325/Sq Ft
Est. Value
About This Home
This home is located at 278 Centre St Unit 2, Quincy, MA 02169 and is currently estimated at $1,054,884, approximately $325 per square foot. 278 Centre St Unit 2 is a home located in Norfolk County with nearby schools including South West Middle School, Lincoln-Hancock Community School, and Quincy High School.
Ownership History
Date
Name
Owned For
Owner Type
Purchase Details
Closed on
Aug 25, 1995
Sold by
Centre Assoc
Bought by
Arpano Int
Current Estimated Value
Home Financials for this Owner
Home Financials are based on the most recent Mortgage that was taken out on this home.
Original Mortgage
$200,000
Interest Rate
7.32%
Mortgage Type
Commercial
Create a Home Valuation Report for This Property
The Home Valuation Report is an in-depth analysis detailing your home's value as well as a comparison with similar homes in the area
Home Values in the Area
Average Home Value in this Area
Purchase History
| Date | Buyer | Sale Price | Title Company |
|---|---|---|---|
| Arpano Int | $265,000 | -- |
Source: Public Records
Mortgage History
| Date | Status | Borrower | Loan Amount |
|---|---|---|---|
| Open | Arpano Int | $188,500 | |
| Closed | Arpano Int | $200,000 |
Source: Public Records
Tax History Compared to Growth
Tax History
| Year | Tax Paid | Tax Assessment Tax Assessment Total Assessment is a certain percentage of the fair market value that is determined by local assessors to be the total taxable value of land and additions on the property. | Land | Improvement |
|---|---|---|---|---|
| 2025 | $23,339 | $1,014,300 | $221,400 | $792,900 |
| 2024 | $17,594 | $783,700 | $219,200 | $564,500 |
| 2023 | $16,713 | $753,500 | $217,000 | $536,500 |
| 2022 | $17,349 | $727,100 | $206,700 | $520,400 |
| 2021 | $17,436 | $719,900 | $204,600 | $515,300 |
| 2020 | $17,515 | $705,100 | $202,600 | $502,500 |
| 2019 | $17,409 | $691,400 | $200,600 | $490,800 |
| 2018 | $18,517 | $684,800 | $198,600 | $486,200 |
| 2017 | $19,124 | $666,100 | $192,900 | $473,200 |
| 2016 | $19,557 | $665,900 | $192,900 | $473,000 |
| 2015 | $20,426 | $675,000 | $192,900 | $482,100 |
| 2014 | $20,406 | $653,400 | $192,900 | $460,500 |
Source: Public Records
Map
Nearby Homes
- 21 Totman St Unit 202
- 21 Totman St Unit 309
- 21 Totman St Unit Model-1
- 21 Totman St Unit 209
- 21 Totman St Unit 203
- 21 Totman St Unit 2
- 347 Centre St
- 118 Brook Rd Unit 2
- 56 Penn St Unit 4
- 94 Brook Rd Unit 3
- 72 Federal Ave
- 64 Garfield St Unit B
- 91 Garfield St
- 51 Brook Rd
- 21 Arthur St
- 192 Federal Ave Unit B
- 12 Arthur Ave
- 14 Arthur Ave
- 8 Jackson St Unit B2
- 177 Franklin St
- 278 Centre St
- 123 Intervale St Unit 125
- 288 Centre St
- 115 Intervale St
- 21 Caledonia Ave
- 122 Intervale St
- 23 Caledonia Ave Unit 23
- 17 Caledonia Ave
- 15 Caledonia Ave
- 114 Intervale St
- 114 Intervale St Unit Left Side
- 114 Intervale St Unit 116
- 114 Intervale St Unit 1
- 114 Intervale St Unit 114
- 291 Centre St
- 71 Rodman St
- 151 Intervale St Unit rear
- 151 Intervale St
- 153 Intervale St Unit 153
- 153 Intervale St