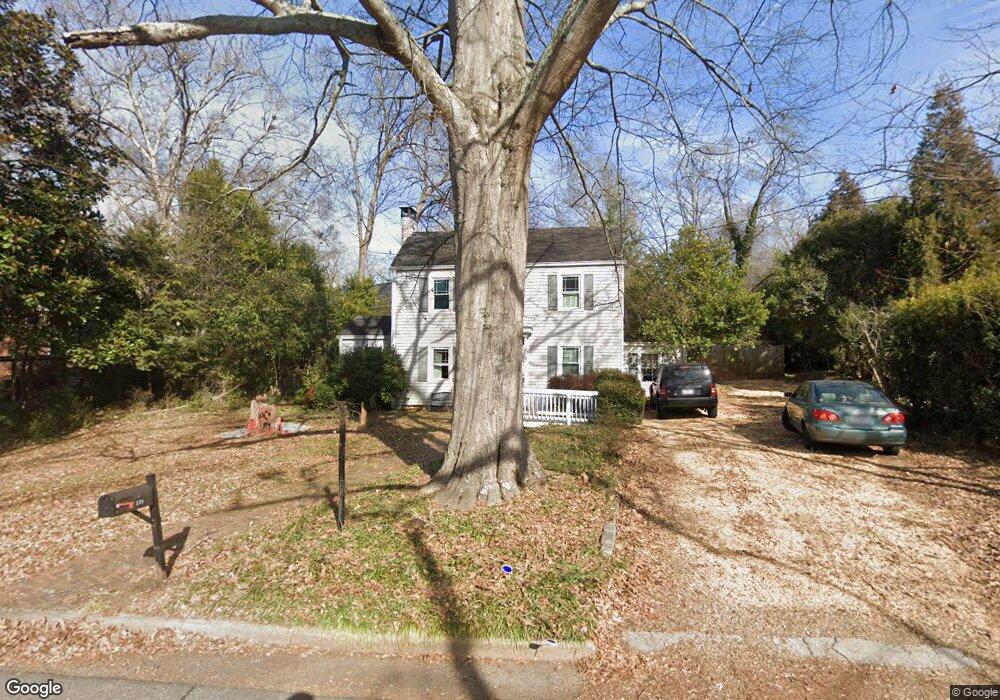
278 Cherokee Ave Athens, GA 30606
Five Points NeighborhoodEstimated Value: $669,000 - $855,000
--
Bed
--
Bath
1,767
Sq Ft
$413/Sq Ft
Est. Value
About This Home
This home is located at 278 Cherokee Ave, Athens, GA 30606 and is currently estimated at $730,176, approximately $413 per square foot. 278 Cherokee Ave is a home located in Clarke County with nearby schools including Barrow Elementary School, Clarke Middle School, and Clarke Central High School.
Ownership History
Date
Name
Owned For
Owner Type
Purchase Details
Closed on
Oct 15, 2004
Sold by
Dicer Gary N and Dicer Julie R
Bought by
Dicer Julie R
Current Estimated Value
Purchase Details
Closed on
Mar 4, 2003
Sold by
Dicer Donald N and Dicer Julie R
Bought by
Dicer Gary N and Dicer Julie R
Purchase Details
Closed on
Nov 16, 2000
Sold by
Burton Joanne Synder
Bought by
Dicer Donald N and Dicer Julie R
Purchase Details
Closed on
Dec 8, 1998
Sold by
Burton Joanne Synder
Bought by
Burton Joanne Synder and Burton Thomas A
Purchase Details
Closed on
Mar 26, 1998
Sold by
Burton Thomas A
Bought by
Burton Joanne Synder
Purchase Details
Closed on
Jul 19, 1993
Sold by
Burton Thomas A and Burton Susanne F
Bought by
Burton Thomas A
Purchase Details
Closed on
Dec 31, 1992
Sold by
Towns Forrest Craig and Towns Havilyn H
Bought by
Burton Thomas A and Burton Susanne F
Purchase Details
Closed on
Aug 16, 1989
Sold by
Olson Susan L and Granrose John T
Bought by
Towns Forrest Craig and Towns Havilyn H
Create a Home Valuation Report for This Property
The Home Valuation Report is an in-depth analysis detailing your home's value as well as a comparison with similar homes in the area
Home Values in the Area
Average Home Value in this Area
Purchase History
| Date | Buyer | Sale Price | Title Company |
|---|---|---|---|
| Dicer Julie R | -- | -- | |
| Dicer Gary N | -- | -- | |
| Dicer Donald N | $203,000 | -- | |
| Burton Joanne Synder | -- | -- | |
| Burton Joanne Synder | -- | -- | |
| Burton Thomas A | -- | -- | |
| Burton Thomas A | $114,000 | -- | |
| Towns Forrest Craig | $83,000 | -- |
Source: Public Records
Tax History Compared to Growth
Tax History
| Year | Tax Paid | Tax Assessment Tax Assessment Total Assessment is a certain percentage of the fair market value that is determined by local assessors to be the total taxable value of land and additions on the property. | Land | Improvement |
|---|---|---|---|---|
| 2025 | $6,948 | $245,675 | $72,000 | $173,675 |
| 2024 | $6,948 | $230,482 | $66,600 | $163,882 |
| 2023 | $6,703 | $207,772 | $66,600 | $141,172 |
| 2022 | $5,288 | $175,777 | $63,000 | $112,777 |
| 2021 | $4,921 | $156,017 | $63,000 | $93,017 |
| 2020 | $4,669 | $148,536 | $63,000 | $85,536 |
| 2019 | $4,517 | $143,050 | $63,000 | $80,050 |
| 2018 | $3,975 | $127,090 | $63,000 | $64,090 |
| 2017 | $3,764 | $120,855 | $63,000 | $57,855 |
| 2016 | $3,577 | $115,368 | $63,000 | $52,368 |
| 2015 | $3,192 | $103,875 | $54,000 | $49,875 |
| 2014 | $2,954 | $96,730 | $48,600 | $48,130 |
Source: Public Records
Map
Nearby Homes
- 495 Woodlawn Ave
- 997 S Milledge Ave Unit 2
- 997 S Milledge Ave Unit 3
- 997 S Milledge Ave Unit 1
- 997 S Milledge Ave Unit 4
- 577 W Cloverhurst Ave
- 490 Mcwhorter Dr
- 265 Springdale St
- 590 Highland Ave
- 338 Springdale St
- 169 Fortson Cir
- 1055 Baxter St Unit 504
- 275 Westview Dr
- 221 University Dr
- 2019 S Lumpkin St
- 50 Springdale St
- 255 Bloomfield St
- 206 Fortson Dr
- 183 Parkway Dr
- 275 Oakland Ave
- 290 Cherokee Ave
- 265 Oakland Ave
- 270 Cherokee Ave
- 0 Cherokee Ave Unit 7230522
- 0 Cherokee Ave Unit 7597892
- 0 Cherokee Ave Unit 7244764
- 0 Cherokee Ave Unit 7046561
- 285 Cherokee Ave
- 282 Cherokee Ave
- 255 Oakland Ave
- 275 Cherokee Ave
- 280 Cherokee Ave
- 297 Cherokee Ave
- 274 Oakland Ave
- 260 Cherokee Ave
- 284 Oakland Ave
- 245 Oakland Ave
- 290 Oakland Ave
- 325 Oakland Ave