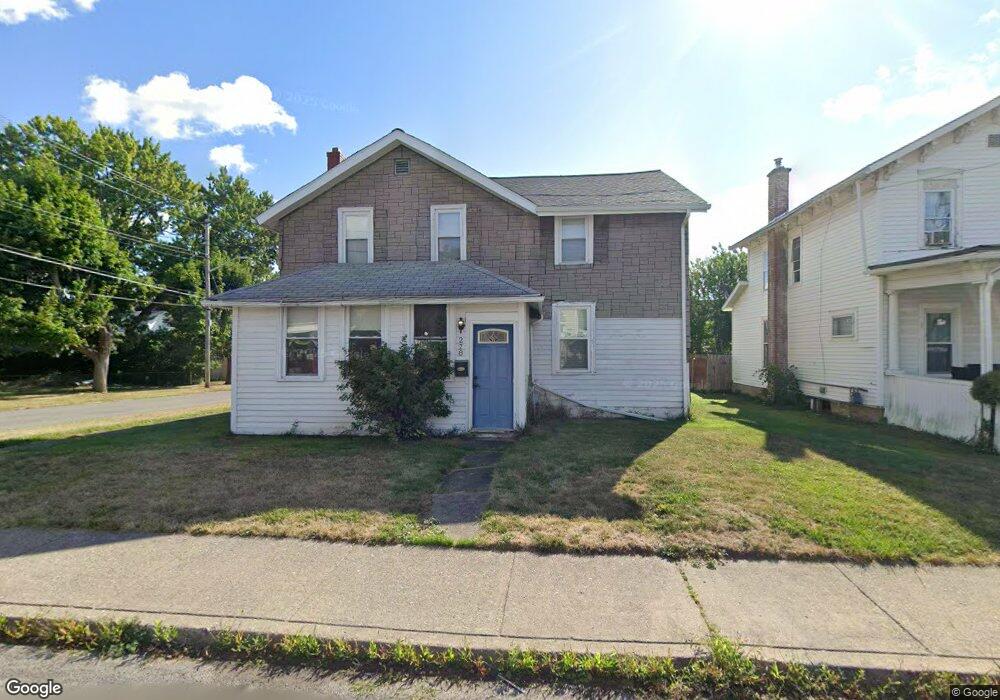
278 Church St Lockport, NY 14094
Estimated Value: $164,000 - $187,000
5
Beds
2
Baths
1,792
Sq Ft
$99/Sq Ft
Est. Value
About This Home
This home is located at 278 Church St, Lockport, NY 14094 and is currently estimated at $177,561, approximately $99 per square foot. 278 Church St is a home located in Niagara County with nearby schools including Aaron Mossell Junior High School, Lockport High School, and DeSales Catholic School.
Ownership History
Date
Name
Owned For
Owner Type
Purchase Details
Closed on
Sep 6, 2006
Sold by
Pearson Craig
Bought by
Morales Peter
Current Estimated Value
Purchase Details
Closed on
May 22, 2006
Sold by
Strickland Jean
Bought by
Pearson Craig
Purchase Details
Closed on
Sep 26, 2003
Sold by
Us Dept Of Hud
Bought by
Pearson Craig
Purchase Details
Closed on
Jun 24, 2003
Sold by
Hsbc Bank
Bought by
Secretary Of Hud
Purchase Details
Closed on
Apr 2, 2003
Sold by
Andrews Scott
Bought by
Hsbc Bank
Create a Home Valuation Report for This Property
The Home Valuation Report is an in-depth analysis detailing your home's value as well as a comparison with similar homes in the area
Home Values in the Area
Average Home Value in this Area
Purchase History
| Date | Buyer | Sale Price | Title Company |
|---|---|---|---|
| Morales Peter | $25,000 | -- | |
| Pearson Craig | $18,218 | Henry Schmidt | |
| Pearson Craig | $19,000 | -- | |
| Secretary Of Hud | -- | Steven J Baum | |
| Secretary Of Hud | -- | Steven J Baum | |
| Hsbc Bank | $49,276 | Steven Baum |
Source: Public Records
Tax History Compared to Growth
Tax History
| Year | Tax Paid | Tax Assessment Tax Assessment Total Assessment is a certain percentage of the fair market value that is determined by local assessors to be the total taxable value of land and additions on the property. | Land | Improvement |
|---|---|---|---|---|
| 2024 | $3,832 | $141,000 | $3,200 | $137,800 |
| 2023 | $3,802 | $136,000 | $3,200 | $132,800 |
| 2022 | $2,018 | $124,000 | $3,200 | $120,800 |
| 2021 | $2,018 | $52,300 | $3,900 | $48,400 |
| 2020 | $2,018 | $52,300 | $3,900 | $48,400 |
| 2019 | $452 | $52,300 | $3,900 | $48,400 |
| 2018 | $1,459 | $52,300 | $3,900 | $48,400 |
| 2017 | $1,454 | $52,300 | $3,900 | $48,400 |
| 2016 | $1,408 | $52,300 | $3,900 | $48,400 |
| 2015 | -- | $52,300 | $3,900 | $48,400 |
| 2014 | -- | $52,300 | $3,900 | $48,400 |
Source: Public Records
Map
Nearby Homes