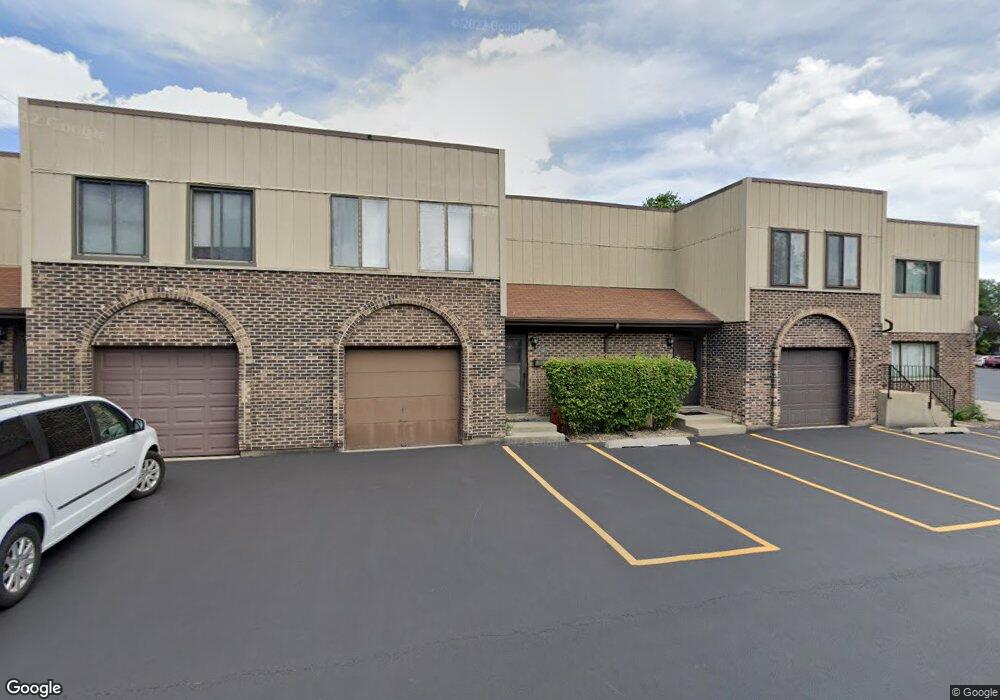
278 E Rimini Ct Unit 278 Palatine, IL 60067
Reseda NeighborhoodEstimated Value: $265,000 - $316,000
3
Beds
--
Bath
1,500
Sq Ft
$187/Sq Ft
Est. Value
About This Home
This home is located at 278 E Rimini Ct Unit 278, Palatine, IL 60067 and is currently estimated at $280,161, approximately $186 per square foot. 278 E Rimini Ct Unit 278 is a home located in Cook County with nearby schools including Lincoln Elementary School, Walter R. Sundling Junior High School, and Palatine High School.
Ownership History
Date
Name
Owned For
Owner Type
Purchase Details
Closed on
Sep 20, 2005
Sold by
Kimberley William R and Kimberley Barbara M
Bought by
Fujino Rachel L
Current Estimated Value
Home Financials for this Owner
Home Financials are based on the most recent Mortgage that was taken out on this home.
Original Mortgage
$196,200
Outstanding Balance
$104,307
Interest Rate
5.75%
Mortgage Type
Purchase Money Mortgage
Estimated Equity
$175,854
Purchase Details
Closed on
Mar 24, 1995
Sold by
Seidman Carol Fox
Bought by
Kimberley William R and Kimberley Barbara M
Home Financials for this Owner
Home Financials are based on the most recent Mortgage that was taken out on this home.
Original Mortgage
$119,700
Interest Rate
8.75%
Purchase Details
Closed on
Oct 31, 1994
Sold by
Fox Pauline
Bought by
Seidman Carol Fox
Create a Home Valuation Report for This Property
The Home Valuation Report is an in-depth analysis detailing your home's value as well as a comparison with similar homes in the area
Home Values in the Area
Average Home Value in this Area
Purchase History
| Date | Buyer | Sale Price | Title Company |
|---|---|---|---|
| Fujino Rachel L | $218,000 | Chicago Title Insurance Comp | |
| Kimberley William R | $126,000 | Intercounty Title | |
| Seidman Carol Fox | -- | -- |
Source: Public Records
Mortgage History
| Date | Status | Borrower | Loan Amount |
|---|---|---|---|
| Open | Fujino Rachel L | $196,200 | |
| Previous Owner | Kimberley William R | $119,700 |
Source: Public Records
Tax History Compared to Growth
Tax History
| Year | Tax Paid | Tax Assessment Tax Assessment Total Assessment is a certain percentage of the fair market value that is determined by local assessors to be the total taxable value of land and additions on the property. | Land | Improvement |
|---|---|---|---|---|
| 2024 | $5,041 | $20,343 | $4,526 | $15,817 |
| 2023 | $4,846 | $20,343 | $4,526 | $15,817 |
| 2022 | $4,846 | $20,343 | $4,526 | $15,817 |
| 2021 | $3,512 | $14,145 | $2,828 | $11,317 |
| 2020 | $3,533 | $14,145 | $2,828 | $11,317 |
| 2019 | $3,548 | $15,802 | $2,828 | $12,974 |
| 2018 | $3,386 | $14,332 | $2,546 | $11,786 |
| 2017 | $3,341 | $14,332 | $2,546 | $11,786 |
| 2016 | $3,356 | $14,332 | $2,546 | $11,786 |
| 2015 | $3,477 | $13,941 | $2,263 | $11,678 |
| 2014 | $3,452 | $13,941 | $2,263 | $11,678 |
| 2013 | $3,345 | $13,941 | $2,263 | $11,678 |
Source: Public Records
Map
Nearby Homes
- 240 E Rimini Ct Unit 240
- 1 Renaissance Place Unit 615
- 1 Renaissance Place Unit 3PH
- 1 Renaissance Place Unit 4PH
- 1 Renaissance Place Unit 1121
- 219 E Reseda Pkwy
- 945 N Carmel Dr
- 522 E Juniper Dr
- 915 N Saratoga Dr
- 298 N Linden Ave
- 1042 N Thackeray Dr
- 621 E Cunningham Dr
- 1109 N Thackeray Dr
- 564 E Princeton St
- 847 E Cooper Dr
- 1288 N Ashland Ave Unit 1
- 524 E Knox St
- 856 E Cooper Dr
- 902 E Plate Dr
- 632 E Delgado Dr
- 280 E Rimini Ct Unit 280
- 276 E Rimini Ct Unit 276
- 282 E Rimini Ct Unit 282
- 274 E Rimini Ct Unit 274
- 272 E Rimini Ct Unit 272
- 284 E Rimini Ct Unit 284
- 292 E Rimini Ct Unit 292
- 290 E Rimini Ct Unit 290
- 294 E Rimini Ct Unit 294
- 286 E Rimini Ct Unit 286
- 296 E Rimini Ct Unit 296
- 264 E Rimini Ct Unit 264
- 262 E Rimini Ct Unit 262
- 266 E Rimini Ct Unit 266
- 268 E Rimini Ct Unit 268
- 260 E Rimini Ct Unit 260
- 258 E Rimini Ct Unit 258
- 270 E Rimini Ct Unit 270
- 300 E Rimini Ct Unit 300
- 304 E Rimini Ct Unit 304