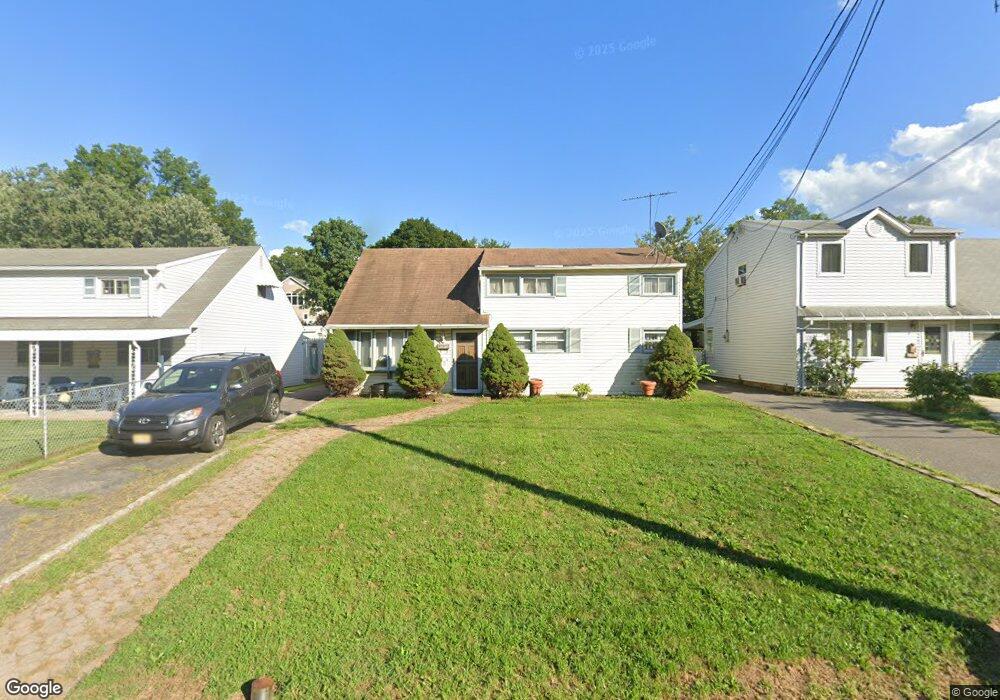
278 Ella Ave Avenel, NJ 07001
Estimated Value: $406,014 - $653,000
5
Beds
2
Baths
1,625
Sq Ft
$333/Sq Ft
Est. Value
About This Home
This home is located at 278 Ella Ave, Avenel, NJ 07001 and is currently estimated at $540,754, approximately $332 per square foot. 278 Ella Ave is a home located in Middlesex County with nearby schools including Woodbine Avenue School, Avenel Middle School, and Colonia High School.
Ownership History
Date
Name
Owned For
Owner Type
Purchase Details
Closed on
Oct 18, 2005
Sold by
Hoffman Matthew
Bought by
Britt Darlene
Current Estimated Value
Home Financials for this Owner
Home Financials are based on the most recent Mortgage that was taken out on this home.
Original Mortgage
$365,000
Interest Rate
6.34%
Mortgage Type
New Conventional
Purchase Details
Closed on
Oct 7, 2003
Sold by
Medina Danny
Bought by
Hoffman Matthew and Hoffman Andrew
Create a Home Valuation Report for This Property
The Home Valuation Report is an in-depth analysis detailing your home's value as well as a comparison with similar homes in the area
Home Values in the Area
Average Home Value in this Area
Purchase History
| Date | Buyer | Sale Price | Title Company |
|---|---|---|---|
| Britt Darlene | $365,000 | -- | |
| Hoffman Matthew | $265,000 | -- |
Source: Public Records
Mortgage History
| Date | Status | Borrower | Loan Amount |
|---|---|---|---|
| Previous Owner | Britt Darlene | $365,000 |
Source: Public Records
Tax History
| Year | Tax Paid | Tax Assessment Tax Assessment Total Assessment is a certain percentage of the fair market value that is determined by local assessors to be the total taxable value of land and additions on the property. | Land | Improvement |
|---|---|---|---|---|
| 2025 | $8,882 | $72,600 | $18,400 | $54,200 |
| 2024 | $8,511 | $72,600 | $18,400 | $54,200 |
Source: Public Records
Map
Nearby Homes