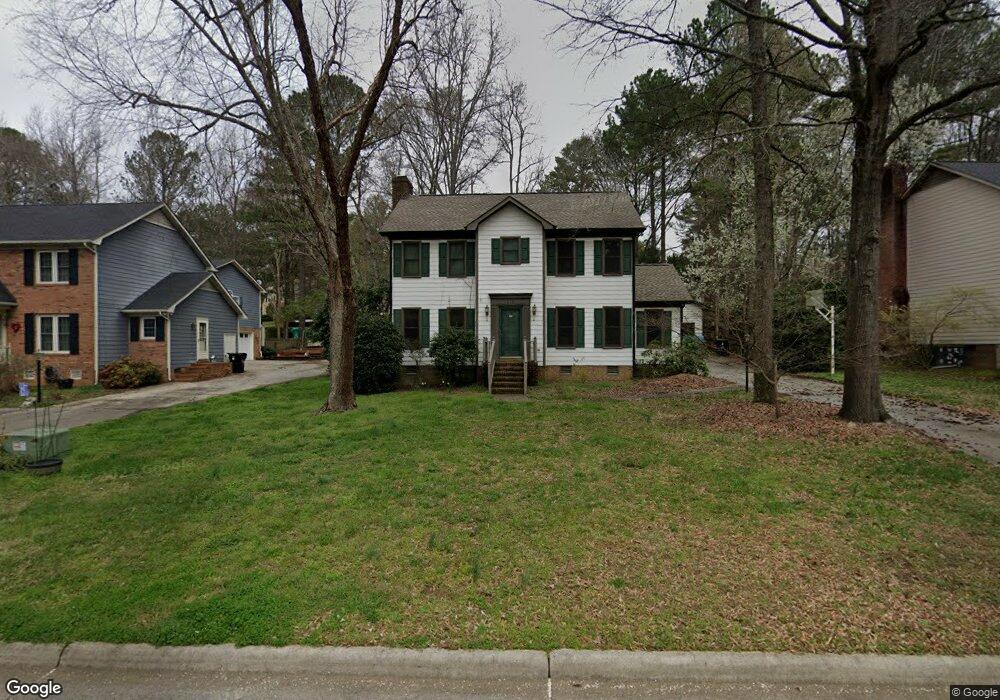
278 Fryling Ave SW Concord, NC 28025
Estimated Value: $356,852 - $391,000
3
Beds
3
Baths
2,184
Sq Ft
$168/Sq Ft
Est. Value
About This Home
This home is located at 278 Fryling Ave SW, Concord, NC 28025 and is currently estimated at $366,713, approximately $167 per square foot. 278 Fryling Ave SW is a home located in Cabarrus County with nearby schools including R Brown Mcallister STEMElementary, Concord Middle School, and Concord High School.
Ownership History
Date
Name
Owned For
Owner Type
Purchase Details
Closed on
Mar 11, 2013
Sold by
Sterling National Bank
Bought by
Best Capital Llc
Current Estimated Value
Purchase Details
Closed on
Jul 20, 2006
Sold by
Simon Richard B and Simon Sara R
Bought by
Odor Richard and Odor Karen Kaser
Home Financials for this Owner
Home Financials are based on the most recent Mortgage that was taken out on this home.
Original Mortgage
$122,400
Interest Rate
6.54%
Mortgage Type
Purchase Money Mortgage
Purchase Details
Closed on
Apr 30, 1999
Sold by
Historic Designs Inc
Bought by
Simon Richard B and Simon Sara R
Home Financials for this Owner
Home Financials are based on the most recent Mortgage that was taken out on this home.
Original Mortgage
$108,000
Interest Rate
7.06%
Purchase Details
Closed on
Oct 14, 1998
Sold by
Radcliffe Hoadley Jonathan J and Radcliffe Kathryn L
Bought by
Historic Designs Inc
Home Financials for this Owner
Home Financials are based on the most recent Mortgage that was taken out on this home.
Original Mortgage
$200,000
Interest Rate
6.8%
Purchase Details
Closed on
May 1, 1995
Purchase Details
Closed on
Aug 1, 1989
Create a Home Valuation Report for This Property
The Home Valuation Report is an in-depth analysis detailing your home's value as well as a comparison with similar homes in the area
Home Values in the Area
Average Home Value in this Area
Purchase History
| Date | Buyer | Sale Price | Title Company |
|---|---|---|---|
| Best Capital Llc | $15,000 | None Available | |
| Odor Richard | $153,000 | None Available | |
| Simon Richard B | $135,000 | -- | |
| Historic Designs Inc | $140,000 | -- | |
| -- | $119,500 | -- | |
| -- | $110,000 | -- |
Source: Public Records
Mortgage History
| Date | Status | Borrower | Loan Amount |
|---|---|---|---|
| Previous Owner | Odor Richard | $122,400 | |
| Previous Owner | Simon Richard B | $108,000 | |
| Previous Owner | Historic Designs Inc | $200,000 |
Source: Public Records
Tax History Compared to Growth
Tax History
| Year | Tax Paid | Tax Assessment Tax Assessment Total Assessment is a certain percentage of the fair market value that is determined by local assessors to be the total taxable value of land and additions on the property. | Land | Improvement |
|---|---|---|---|---|
| 2025 | $3,279 | $329,170 | $78,000 | $251,170 |
| 2024 | $3,279 | $329,170 | $78,000 | $251,170 |
| 2023 | $2,389 | $195,810 | $40,000 | $155,810 |
| 2022 | $2,389 | $195,810 | $40,000 | $155,810 |
| 2021 | $2,389 | $195,810 | $40,000 | $155,810 |
| 2020 | $2,389 | $195,810 | $40,000 | $155,810 |
| 2019 | $2,133 | $174,850 | $36,000 | $138,850 |
| 2018 | $2,098 | $174,850 | $36,000 | $138,850 |
| 2017 | $2,063 | $174,850 | $36,000 | $138,850 |
| 2016 | $1,224 | $169,710 | $36,000 | $133,710 |
| 2015 | $2,003 | $169,710 | $36,000 | $133,710 |
| 2014 | $2,003 | $169,710 | $36,000 | $133,710 |
Source: Public Records
Map
Nearby Homes
- 269 Fryling Ave SW
- 309 Brightwood Ct SW
- 671 Sedgefield St SW
- 159 Fryling Ave SW
- 80 Pounds Ave SW
- 736 Spring St SW
- 358 Cozart Ave SW
- 111 Wilshire Ave SW
- 782 Union St S
- 783 Union St S
- 569 Union St S
- 571 Union St S
- 85 Myrtle Ave SW
- 24 Doris Ct SE
- 23 Lawndale Ave SE
- 355 Melrose Dr SW Unit B
- 355 Melrose Dr SW Unit A
- 355 Melrose Dr SW Unit F
- 34 Rollingwood Dr SE
- 336 Lincoln St SW
- 280 Fryling Ave SW
- 276 Fryling Ave SW
- 690 Crab Tree Ct SW
- 274 Fryling Ave SW
- 692 Crab Tree Ct SW
- 282 Fryling Ave SW
- 688 Crab Tree Ct SW
- 281 Fryling Ave SW
- 272 Fryling Ave SW
- 283 Fryling Ave SW
- 279 Fryling Ave SW
- 277 Fryling Ave SW
- 691 Crab Tree Ct SW
- 270 Fryling Ave SW
- 275 Fryling Ave SW
- 287 Fryling Ave SW
- 689 Crab Tree Ct SW
- 272 Lemon Tree Ln SW
- 273 Fryling Ave SW
- 268 Fryling Ave SW