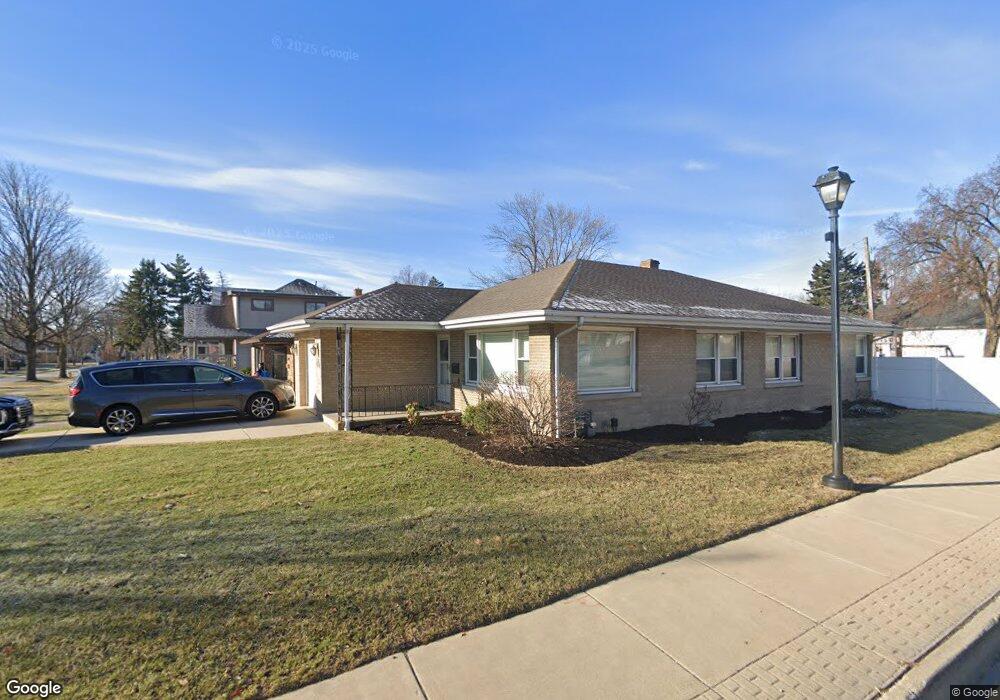
278 N Walnut St Elmhurst, IL 60126
Estimated Value: $458,000 - $509,000
3
Beds
1
Bath
1,380
Sq Ft
$346/Sq Ft
Est. Value
About This Home
This home is located at 278 N Walnut St, Elmhurst, IL 60126 and is currently estimated at $477,459, approximately $345 per square foot. 278 N Walnut St is a home located in DuPage County with nearby schools including Hawthorne Elementary School, Churchville Middle School, and Sandburg Middle School.
Ownership History
Date
Name
Owned For
Owner Type
Purchase Details
Closed on
Sep 14, 2012
Sold by
Alvarez Jonathan and Golz Heidi
Bought by
Alvarez Jonathan and Alvarez Heidi
Current Estimated Value
Home Financials for this Owner
Home Financials are based on the most recent Mortgage that was taken out on this home.
Original Mortgage
$152,000
Outstanding Balance
$105,227
Interest Rate
3.58%
Mortgage Type
New Conventional
Estimated Equity
$372,232
Purchase Details
Closed on
May 26, 2010
Sold by
Lanz Rolando E
Bought by
Alvarez Jonathan and Golz Heidi
Home Financials for this Owner
Home Financials are based on the most recent Mortgage that was taken out on this home.
Original Mortgage
$148,006
Interest Rate
5.5%
Mortgage Type
FHA
Purchase Details
Closed on
Jul 18, 2006
Sold by
Lanz Rolando A
Bought by
Lanz Rolando E and Lanz Maria
Purchase Details
Closed on
Oct 4, 2001
Sold by
Watkins Eula V
Bought by
Lanz Rolando E and Lanz Maria
Create a Home Valuation Report for This Property
The Home Valuation Report is an in-depth analysis detailing your home's value as well as a comparison with similar homes in the area
Home Values in the Area
Average Home Value in this Area
Purchase History
| Date | Buyer | Sale Price | Title Company |
|---|---|---|---|
| Alvarez Jonathan | -- | Citywide Title Corporation | |
| Alvarez Jonathan | $150,000 | Ctic | |
| Lanz Rolando E | -- | None Available | |
| Lanz Rolando E | $188,000 | Stewart Title Company |
Source: Public Records
Mortgage History
| Date | Status | Borrower | Loan Amount |
|---|---|---|---|
| Open | Alvarez Jonathan | $152,000 | |
| Closed | Alvarez Jonathan | $148,006 |
Source: Public Records
Tax History
| Year | Tax Paid | Tax Assessment Tax Assessment Total Assessment is a certain percentage of the fair market value that is determined by local assessors to be the total taxable value of land and additions on the property. | Land | Improvement |
|---|---|---|---|---|
| 2024 | $7,131 | $126,319 | $88,275 | $38,044 |
| 2023 | $6,606 | $116,810 | $81,630 | $35,180 |
| 2022 | $6,445 | $112,290 | $78,470 | $33,820 |
| 2021 | $6,282 | $109,500 | $76,520 | $32,980 |
| 2020 | $6,037 | $107,100 | $74,840 | $32,260 |
| 2019 | $5,902 | $101,820 | $71,150 | $30,670 |
| 2018 | $7,148 | $121,380 | $67,340 | $54,040 |
| 2017 | $6,988 | $115,670 | $64,170 | $51,500 |
| 2016 | $6,835 | $108,970 | $60,450 | $48,520 |
| 2015 | $6,761 | $101,520 | $56,320 | $45,200 |
| 2014 | $6,125 | $85,480 | $49,670 | $35,810 |
| 2013 | $6,060 | $86,680 | $50,370 | $36,310 |
Source: Public Records
Map
Nearby Homes
- 275 W North Ave
- 284 N Highland Ave
- 322 N Highland Ave
- 367 N Oak St
- 365 N Walnut St
- 196 N Walnut St
- 370 N Oak St
- 374 N Myrtle Ave
- 146 N Walnut St
- 270 W Fremont Ave
- 147 N Myrtle Ave
- 461 W Grantley Ave
- 413 N Ridgeland Ave
- 108 Evergreen Ave
- 267 N Larch Ave
- 104 Evergreen Ave
- 332 N West Ave
- 432 N Ridgeland Ave
- 258 N Addison Ave
- 254 N Addison Ave
- 274 N Walnut St
- 270 N Walnut St
- 329 W North Ave
- 266 N Walnut St
- 294 N Walnut St
- 275 N Oak St
- 312 W North Ave
- 279 N Oak St
- 285 N Oak St
- 262 N Walnut St
- 298 N Walnut St
- 271 N Oak St
- 291 N Walnut St
- 277 N Walnut St
- 269 N Walnut St
- 302 N Walnut St
- 299 N Oak St
- 267 N Walnut St
- 265 N Oak St
- 315 W North Ave
Your Personal Tour Guide
Ask me questions while you tour the home.