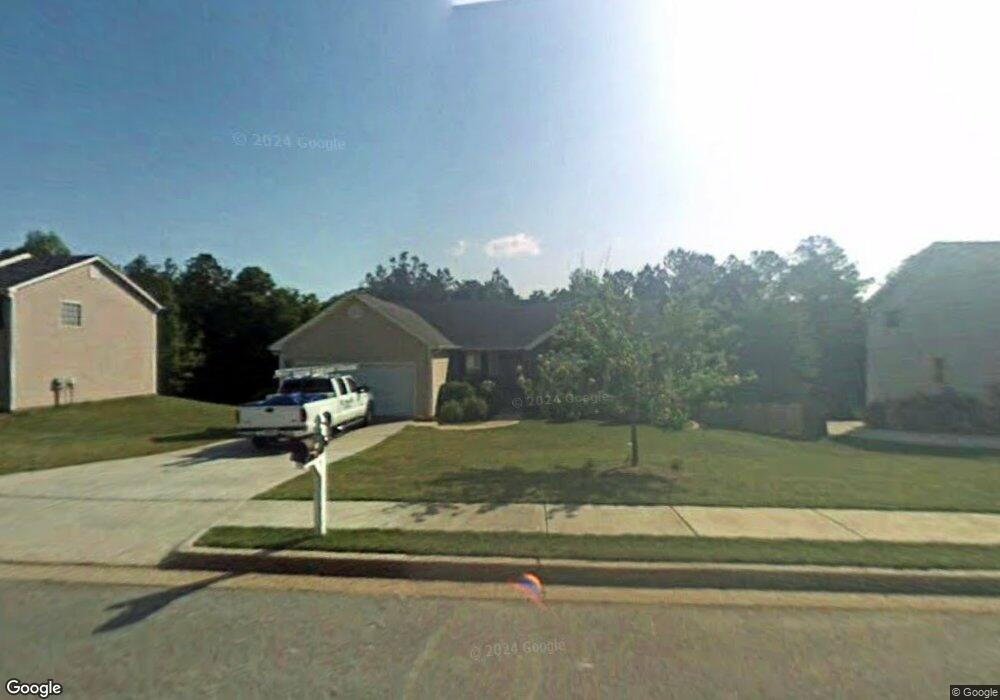
278 Natchez Cir Winder, GA 30680
Estimated Value: $360,000 - $386,000
--
Bed
3
Baths
2,019
Sq Ft
$184/Sq Ft
Est. Value
About This Home
This home is located at 278 Natchez Cir, Winder, GA 30680 and is currently estimated at $370,748, approximately $183 per square foot. 278 Natchez Cir is a home located in Barrow County with nearby schools including County Line Elementary School, Russell Middle School, and Winder-Barrow High School.
Ownership History
Date
Name
Owned For
Owner Type
Purchase Details
Closed on
Jul 31, 2003
Sold by
Rpm Hm Builders Llc
Bought by
Williams Jason and Williams Nicole
Current Estimated Value
Home Financials for this Owner
Home Financials are based on the most recent Mortgage that was taken out on this home.
Original Mortgage
$122,680
Outstanding Balance
$54,416
Interest Rate
5.72%
Mortgage Type
New Conventional
Estimated Equity
$316,332
Purchase Details
Closed on
Jun 6, 2003
Sold by
Southfork Homes Inc
Bought by
Rpm Home Buiilders Llc
Home Financials for this Owner
Home Financials are based on the most recent Mortgage that was taken out on this home.
Original Mortgage
$122,680
Outstanding Balance
$54,416
Interest Rate
5.72%
Mortgage Type
New Conventional
Estimated Equity
$316,332
Purchase Details
Closed on
Feb 22, 2002
Sold by
Dogwood Enterprises
Bought by
Southfork Homes Inc
Purchase Details
Closed on
Aug 6, 1998
Bought by
Dogwood Enterprises
Create a Home Valuation Report for This Property
The Home Valuation Report is an in-depth analysis detailing your home's value as well as a comparison with similar homes in the area
Home Values in the Area
Average Home Value in this Area
Purchase History
| Date | Buyer | Sale Price | Title Company |
|---|---|---|---|
| Williams Jason | $153,400 | -- | |
| Rpm Home Buiilders Llc | $30,800 | -- | |
| Southfork Homes Inc | -- | -- | |
| Dogwood Enterprises | -- | -- |
Source: Public Records
Mortgage History
| Date | Status | Borrower | Loan Amount |
|---|---|---|---|
| Open | Williams Jason | $122,680 |
Source: Public Records
Tax History Compared to Growth
Tax History
| Year | Tax Paid | Tax Assessment Tax Assessment Total Assessment is a certain percentage of the fair market value that is determined by local assessors to be the total taxable value of land and additions on the property. | Land | Improvement |
|---|---|---|---|---|
| 2024 | $3,470 | $141,941 | $27,200 | $114,741 |
| 2023 | $2,974 | $141,941 | $27,200 | $114,741 |
| 2022 | $3,273 | $108,488 | $22,800 | $85,688 |
| 2021 | $2,888 | $89,924 | $16,000 | $73,924 |
| 2020 | $2,695 | $86,983 | $16,000 | $70,983 |
| 2019 | $2,531 | $78,701 | $13,600 | $65,101 |
| 2018 | $2,379 | $72,819 | $13,600 | $59,219 |
| 2017 | $1,870 | $62,676 | $13,600 | $49,076 |
| 2016 | $1,832 | $58,541 | $13,600 | $44,941 |
| 2015 | $1,850 | $59,042 | $13,600 | $45,442 |
| 2014 | $1,623 | $52,802 | $6,860 | $45,942 |
| 2013 | -- | $49,883 | $6,860 | $43,023 |
Source: Public Records
Map
Nearby Homes
- 94 Garrison Dr
- 292 Natchez Cir
- 486 Jasmine Dr
- 295 Cedar Wood Trace
- 276 Cedar Wood Trace
- 273 Cedar Wood Trace
- 264 Cedar Wood Trace
- 261 Cedar Wood Trace
- 240 Cedar Wood Trace
- 719 Overlook Dr
- 713 Mallard Dr
- 109 Cedar Wood Trace
- 418 Jasmine Dr
- 133 Cedar Wood Trace
- 244 Bayou Ln Unit 1
- 74 Cannon Trace Dr
- 49 Cannondale Dr
- 98 Cannondale Dr
- 62 Garrison Dr
- 66 Garrison Dr
- 278 Natchez Cir Unit 2
- 276 Natchez Cir Unit 2
- 280 Natchez Cir
- 274 Natchez Cir
- 282 Natchez Cir
- 277 Natchez Cir Unit 2
- 279 Natchez Cir Unit 2
- 275 Natchez Cir Unit 2
- 275 Natchez Cir
- 281 Natchez Cir
- 281 Natchez Cir Unit 2
- 272 Natchez Cir
- 273 Natchez Cir
- 284 Natchez Cir Unit 2
- 283 Natchez Cir Unit 2
- 168 Bellingrath Dr Unit 1
- 172 Bellingrath Dr
- 271 Natchez Cir Unit 2
- 271 Natchez Cir
- 164 Bellingrath Dr