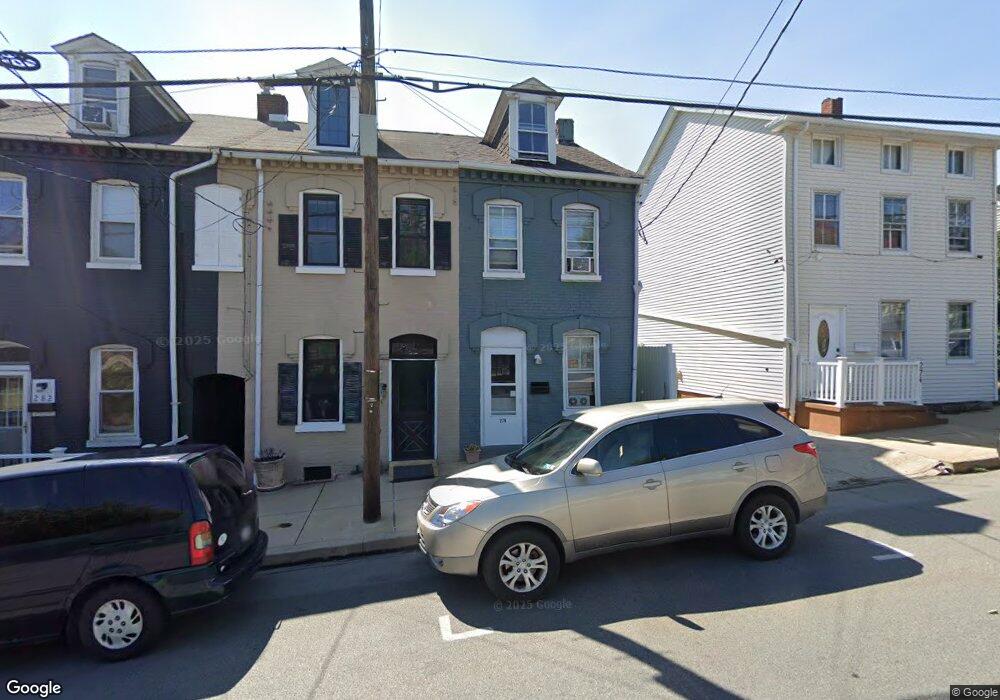
278 S 4th St Columbia, PA 17512
Estimated Value: $150,000 - $159,547
3
Beds
1
Bath
998
Sq Ft
$155/Sq Ft
Est. Value
About This Home
This home is located at 278 S 4th St, Columbia, PA 17512 and is currently estimated at $154,387, approximately $154 per square foot. 278 S 4th St is a home located in Lancaster County with nearby schools including Columbia Middle School, Columbia High School, and Our Lady of the Angels School.
Ownership History
Date
Name
Owned For
Owner Type
Purchase Details
Closed on
Jun 25, 2001
Sold by
Moore Kenneth R and Bartch Kimberly A
Bought by
Bartch Kimberly A
Current Estimated Value
Purchase Details
Closed on
Dec 20, 2000
Sold by
Johnson Steven A
Bought by
Rineer Stephen G
Home Financials for this Owner
Home Financials are based on the most recent Mortgage that was taken out on this home.
Original Mortgage
$53,600
Outstanding Balance
$19,752
Interest Rate
7.7%
Estimated Equity
$134,635
Create a Home Valuation Report for This Property
The Home Valuation Report is an in-depth analysis detailing your home's value as well as a comparison with similar homes in the area
Home Values in the Area
Average Home Value in this Area
Purchase History
| Date | Buyer | Sale Price | Title Company |
|---|---|---|---|
| Bartch Kimberly A | $23,435 | -- | |
| Rineer Stephen G | $58,000 | -- |
Source: Public Records
Mortgage History
| Date | Status | Borrower | Loan Amount |
|---|---|---|---|
| Open | Rineer Stephen G | $53,600 |
Source: Public Records
Tax History Compared to Growth
Tax History
| Year | Tax Paid | Tax Assessment Tax Assessment Total Assessment is a certain percentage of the fair market value that is determined by local assessors to be the total taxable value of land and additions on the property. | Land | Improvement |
|---|---|---|---|---|
| 2025 | $1,913 | $51,200 | $5,900 | $45,300 |
| 2024 | $1,913 | $51,200 | $5,900 | $45,300 |
| 2023 | $1,913 | $51,200 | $5,900 | $45,300 |
| 2022 | $1,913 | $51,200 | $5,900 | $45,300 |
| 2021 | $1,913 | $51,200 | $5,900 | $45,300 |
| 2020 | $1,913 | $51,200 | $5,900 | $45,300 |
| 2019 | $1,880 | $51,200 | $5,900 | $45,300 |
| 2018 | $1,012 | $51,200 | $5,900 | $45,300 |
| 2017 | $2,276 | $55,400 | $11,300 | $44,100 |
| 2016 | $2,276 | $55,400 | $11,300 | $44,100 |
| 2015 | $650 | $55,400 | $11,300 | $44,100 |
| 2014 | $1,261 | $55,400 | $11,300 | $44,100 |
Source: Public Records
Map
Nearby Homes