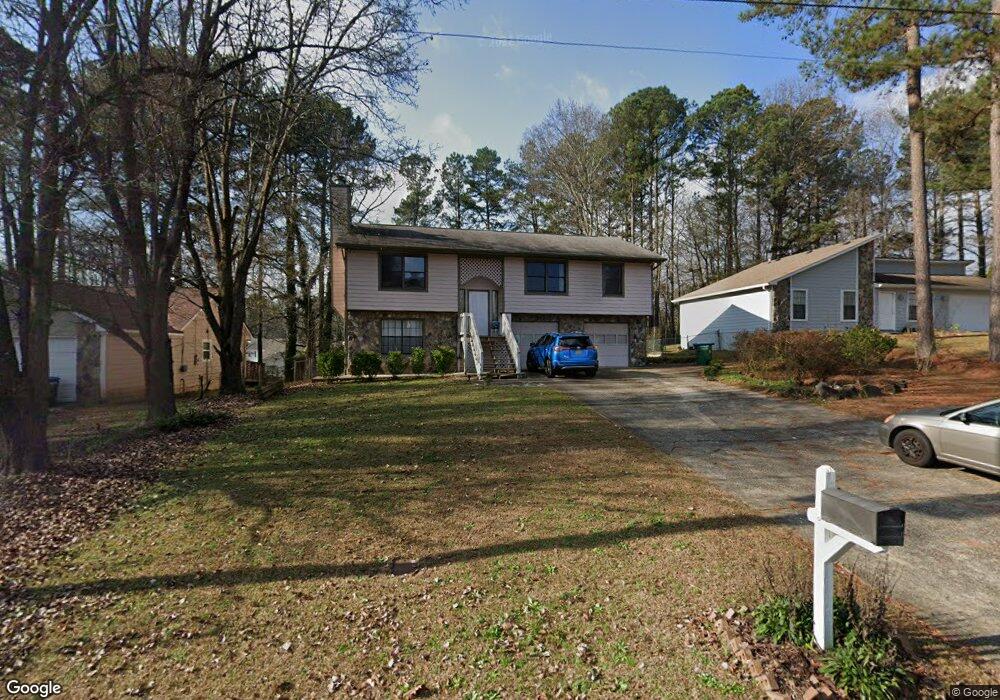
2780 Blarney Way Duluth, GA 30096
Estimated Value: $369,000 - $408,000
4
Beds
3
Baths
1,884
Sq Ft
$204/Sq Ft
Est. Value
About This Home
This home is located at 2780 Blarney Way, Duluth, GA 30096 and is currently estimated at $384,416, approximately $204 per square foot. 2780 Blarney Way is a home located in Gwinnett County with nearby schools including Charles Brant Chesney Elementary School, Duluth Middle School, and Duluth High School.
Ownership History
Date
Name
Owned For
Owner Type
Purchase Details
Closed on
Aug 24, 2023
Sold by
Lin Hong
Bought by
Lin Hong Tr and Shan An Tr
Current Estimated Value
Purchase Details
Closed on
Jun 30, 2017
Sold by
Lin Hong
Bought by
Lin Hong and Lin Shan
Home Financials for this Owner
Home Financials are based on the most recent Mortgage that was taken out on this home.
Original Mortgage
$136,000
Interest Rate
3.94%
Mortgage Type
New Conventional
Purchase Details
Closed on
Oct 26, 2011
Sold by
Federal National Mortgage Association
Bought by
Lin Hong
Purchase Details
Closed on
Jun 7, 2011
Sold by
Wells Fargo Bk Na
Bought by
Federal Natl Mtg Assn Fnma
Purchase Details
Closed on
Feb 3, 2009
Sold by
Wells Fargo Bk Na
Bought by
Federal Natl Mtg Assn Fnma
Purchase Details
Closed on
Apr 15, 1996
Sold by
Lahatte Gregory P Margaret
Bought by
Sheinfeld Scott P Sandra C
Create a Home Valuation Report for This Property
The Home Valuation Report is an in-depth analysis detailing your home's value as well as a comparison with similar homes in the area
Home Values in the Area
Average Home Value in this Area
Purchase History
| Date | Buyer | Sale Price | Title Company |
|---|---|---|---|
| Lin Hong Tr | -- | -- | |
| Lin Hong | $143,700 | -- | |
| Lin Hong | $64,250 | -- | |
| Federal Natl Mtg Assn Fnma | -- | -- | |
| Wells Fargo Bk Na | $54,400 | -- | |
| Federal Natl Mtg Assn Fnma | -- | -- | |
| Wells Fargo Bk Na | $131,828 | -- | |
| Sheinfeld Scott P Sandra C | $102,500 | -- |
Source: Public Records
Mortgage History
| Date | Status | Borrower | Loan Amount |
|---|---|---|---|
| Previous Owner | Lin Hong | $136,000 | |
| Closed | Sheinfeld Scott P Sandra C | $0 |
Source: Public Records
Tax History
| Year | Tax Paid | Tax Assessment Tax Assessment Total Assessment is a certain percentage of the fair market value that is determined by local assessors to be the total taxable value of land and additions on the property. | Land | Improvement |
|---|---|---|---|---|
| 2025 | -- | $156,840 | $27,880 | $128,960 |
| 2024 | $5,272 | $137,720 | $26,400 | $111,320 |
| 2023 | $5,272 | $141,600 | $22,000 | $119,600 |
| 2022 | $3,528 | $129,960 | $22,000 | $107,960 |
| 2021 | $2,913 | $97,960 | $16,000 | $81,960 |
| 2020 | $2,834 | $93,280 | $16,000 | $77,280 |
| 2019 | $2,640 | $87,000 | $16,000 | $71,000 |
| 2018 | $2,302 | $71,440 | $12,800 | $58,640 |
| 2016 | $2,022 | $57,480 | $12,800 | $44,680 |
| 2015 | $2,011 | $57,480 | $12,800 | $44,680 |
| 2014 | -- | $44,640 | $10,000 | $34,640 |
Source: Public Records
Map
Nearby Homes
- 2667 Camelot Ct
- 4298 Buckingham Place
- 4242 Trail
- 4305 Morrison Lake Ct
- 2852 Inverloch Cir
- 2925 Landington Way
- 2820 Skye Terrace
- 2935 Landington Way
- 3857 Centennial Trail
- 3927 Centennial Trail Unit III
- 4569 Iroquois Trail
- 4128 Buckingham Place
- 4196 Buford Hwy
- 4085 Fastnet Ln Unit 3
- 4641 Broadwater Trail
- 4136 Buford Hwy
- 4045 Cranston Ct Unit 4
- 2730 Shelter Cove NW
- 4110 Megan Rd Unit 2
- 4578 Simpson Mill Ln
- 2770 Blarney Way
- 2790 Blarney Way
- 2790 Blarney Way Unit 71
- 2800 Blarney Way
- 2800 Blarney Way
- 2800 Blarney Way NW
- 2765 Woodbine Hill Way
- 2755 Woodbine Hill Way Unit 1
- 2775 Woodbine Hill Way
- 2791 Blarney Way Unit 4
- 2781 Blarney Way
- 2745 Woodbine Hill Way
- 2750 Blarney Way
- 2810 Blarney Way Unit 4
- 2750 Blarney Way NW
- 2785 Woodbine Hill Way
- 2771 Blarney Way
- 2735 Woodbine Hill Way
- 2761 Blarney Way
- 2795 Woodbine Hill Way
Your Personal Tour Guide
Ask me questions while you tour the home.