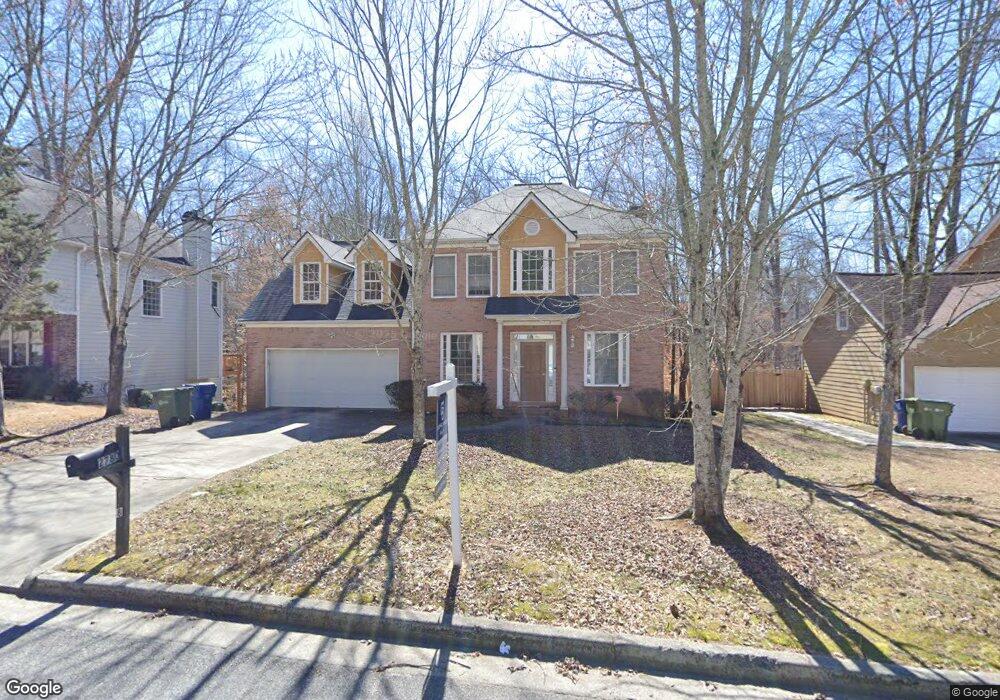
2780 Emerald Ct SW Unit 19 Atlanta, GA 30311
Harland Terrace NeighborhoodEstimated Value: $310,000 - $337,000
3
Beds
3
Baths
2,096
Sq Ft
$156/Sq Ft
Est. Value
About This Home
This home is located at 2780 Emerald Ct SW Unit 19, Atlanta, GA 30311 and is currently estimated at $326,401, approximately $155 per square foot. 2780 Emerald Ct SW Unit 19 is a home located in Fulton County with nearby schools including Peyton Forest Elementary School, Young Middle School, and Mays High School.
Ownership History
Date
Name
Owned For
Owner Type
Purchase Details
Closed on
Apr 25, 2025
Sold by
Ohienmhen Damian
Bought by
Damian Ohienmhen Revocable Living Trust and Ohienmhen Damian Trust
Current Estimated Value
Home Financials for this Owner
Home Financials are based on the most recent Mortgage that was taken out on this home.
Original Mortgage
$283,500
Interest Rate
6.95%
Mortgage Type
New Conventional
Purchase Details
Closed on
Feb 28, 2025
Sold by
Stepp Gail
Bought by
Damian Ohienmhen
Home Financials for this Owner
Home Financials are based on the most recent Mortgage that was taken out on this home.
Original Mortgage
$283,500
Interest Rate
6.95%
Mortgage Type
New Conventional
Purchase Details
Closed on
Feb 22, 2013
Sold by
Federal Home Loan Mortgage Corporation
Bought by
Stepp Gail
Purchase Details
Closed on
Dec 7, 2010
Sold by
Onewest Bk Fsb
Bought by
Federal Home Loan Mortgage Corporation
Purchase Details
Closed on
Apr 29, 2004
Sold by
Gem Construction Llc
Bought by
Barlay Thua
Home Financials for this Owner
Home Financials are based on the most recent Mortgage that was taken out on this home.
Original Mortgage
$156,320
Interest Rate
5.78%
Mortgage Type
New Conventional
Create a Home Valuation Report for This Property
The Home Valuation Report is an in-depth analysis detailing your home's value as well as a comparison with similar homes in the area
Home Values in the Area
Average Home Value in this Area
Purchase History
| Date | Buyer | Sale Price | Title Company |
|---|---|---|---|
| Damian Ohienmhen Revocable Living Trust | -- | -- | |
| Damian Ohienmhen | $315,000 | -- | |
| Stepp Gail | $74,000 | -- | |
| Federal Home Loan Mortgage Corporation | -- | -- | |
| Onewest Bk Fsb | $70,000 | -- | |
| Barlay Thua | $195,400 | -- |
Source: Public Records
Mortgage History
| Date | Status | Borrower | Loan Amount |
|---|---|---|---|
| Previous Owner | Damian Ohienmhen | $283,500 | |
| Previous Owner | Barlay Thua | $156,320 |
Source: Public Records
Tax History Compared to Growth
Tax History
| Year | Tax Paid | Tax Assessment Tax Assessment Total Assessment is a certain percentage of the fair market value that is determined by local assessors to be the total taxable value of land and additions on the property. | Land | Improvement |
|---|---|---|---|---|
| 2025 | $1,578 | $138,040 | $27,640 | $110,400 |
| 2023 | $1,578 | $121,400 | $31,200 | $90,200 |
| 2022 | $586 | $79,440 | $13,000 | $66,440 |
| 2021 | $494 | $77,120 | $12,640 | $64,480 |
| 2020 | $459 | $76,200 | $12,480 | $63,720 |
| 2019 | $354 | $64,600 | $13,560 | $51,040 |
| 2018 | $873 | $63,080 | $13,240 | $49,840 |
| 2017 | $825 | $60,640 | $12,720 | $47,920 |
| 2016 | $826 | $60,640 | $12,720 | $47,920 |
| 2015 | $1,183 | $60,640 | $12,720 | $47,920 |
| 2014 | $714 | $56,760 | $11,920 | $44,840 |
Source: Public Records
Map
Nearby Homes
- 80 Harlan Rd SW
- 187 Peyton Place SW
- 265 Peyton Place SW
- 257 Peyton Place SW
- 155 Peyton Place SW
- 79 Peyton Place SW
- 37 Peyton Place SW
- 233 Peyton Place SW
- 0 SW Unit 10348520
- 0 Peyton Place SW Unit 10592998
- 0 Peyton Place SW Unit 7639500
- 2817 Burton Rd NW
- 2942 Delmar Ln NW
- 2835 Burton Rd NW
- 2682 Burton Rd NW
- 360 Peyton Rd SW
- 2826 Hedgewood Dr NW
- 2836 Hedgewood Dr NW
- 2710 Hedgewood Dr NW
- 3021 Delmar Ln NW
- 2774 Emerald Ct SW
- 2790 Emerald Ct SW
- 2768 Emerald Ct SW
- 2798 Emerald Ct SW
- 2801 Tee Rd SW
- 2783 Emerald Ct SW
- 2775 Emerald Ct SW
- 2831 Tee Rd SW
- 2791 Emerald Ct SW
- 2791 Tee Rd SW
- 2758 Emerald Ct SW
- 2806 Emerald Ct SW
- 0 Emeral Ct SW Unit 8538269
- 0 Emeral Ct SW Unit 8531846
- 0 Emeral Ct SW Unit 8211567
- 0 Emeral Ct SW
- 2767 Emerald Ct SW
- 2799 Emerald Ct SW
- 2781 Tee Rd SW
- 2759 Emerald Ct SW