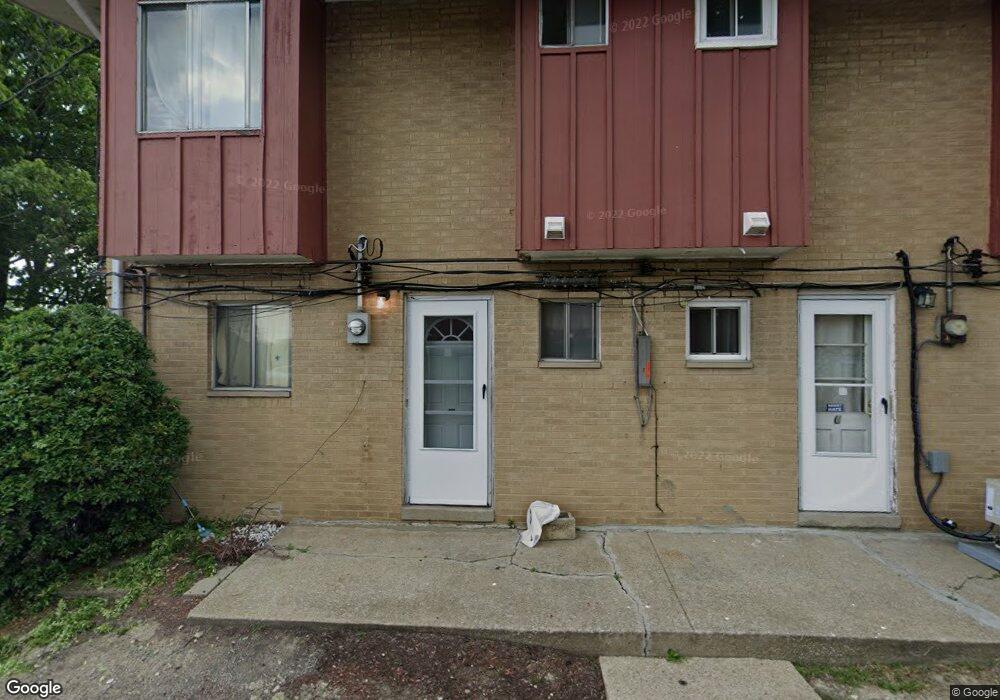
27801 Mills Ave Euclid, OH 44132
Estimated Value: $66,000 - $79,000
3
Beds
2
Baths
1,176
Sq Ft
$60/Sq Ft
Est. Value
About This Home
This home is located at 27801 Mills Ave, Euclid, OH 44132 and is currently estimated at $70,921, approximately $60 per square foot. 27801 Mills Ave is a home located in Cuyahoga County with nearby schools including Bluestone Elementary School, Euclid High School, and All Saints of St. John Vianney School.
Ownership History
Date
Name
Owned For
Owner Type
Purchase Details
Closed on
Jul 20, 1994
Sold by
Nagle Edward M
Bought by
Thornton Rudy J
Current Estimated Value
Home Financials for this Owner
Home Financials are based on the most recent Mortgage that was taken out on this home.
Original Mortgage
$26,400
Interest Rate
4.99%
Mortgage Type
New Conventional
Purchase Details
Closed on
Oct 8, 1993
Sold by
Nagel Edward M
Bought by
Nagel Edward M
Purchase Details
Closed on
May 20, 1993
Sold by
Orient Linda A
Bought by
Nagel Edward M
Purchase Details
Closed on
Dec 14, 1990
Sold by
Arliss M Christopher
Bought by
Orient Linda A
Purchase Details
Closed on
Jun 17, 1982
Sold by
Christopher Nick
Bought by
Arliss M Christopher
Purchase Details
Closed on
Nov 4, 1981
Sold by
Christopher Nick and Christopher Arliss M
Bought by
Christopher Nick
Purchase Details
Closed on
Jan 1, 1975
Bought by
Christopher Nick and Christopher Arliss M
Create a Home Valuation Report for This Property
The Home Valuation Report is an in-depth analysis detailing your home's value as well as a comparison with similar homes in the area
Home Values in the Area
Average Home Value in this Area
Purchase History
| Date | Buyer | Sale Price | Title Company |
|---|---|---|---|
| Thornton Rudy J | $33,000 | -- | |
| Nagel Edward M | -- | -- | |
| Nagel Edward M | $21,500 | -- | |
| Orient Linda A | $22,000 | -- | |
| Arliss M Christopher | -- | -- | |
| Christopher Nick | -- | -- | |
| Christopher Nick | -- | -- |
Source: Public Records
Mortgage History
| Date | Status | Borrower | Loan Amount |
|---|---|---|---|
| Closed | Thornton Rudy J | $26,400 |
Source: Public Records
Tax History Compared to Growth
Tax History
| Year | Tax Paid | Tax Assessment Tax Assessment Total Assessment is a certain percentage of the fair market value that is determined by local assessors to be the total taxable value of land and additions on the property. | Land | Improvement |
|---|---|---|---|---|
| 2024 | $1,386 | $18,725 | $1,890 | $16,835 |
| 2023 | $963 | $9,870 | $980 | $8,890 |
| 2022 | $944 | $9,870 | $980 | $8,890 |
| 2021 | $1,039 | $9,870 | $980 | $8,890 |
| 2020 | $841 | $7,000 | $700 | $6,300 |
| 2019 | $735 | $20,000 | $2,000 | $18,000 |
| 2018 | $741 | $7,000 | $700 | $6,300 |
| 2017 | $803 | $6,410 | $670 | $5,740 |
| 2016 | $805 | $6,410 | $670 | $5,740 |
| 2015 | $3,777 | $6,410 | $670 | $5,740 |
| 2014 | $3,777 | $12,820 | $1,300 | $11,520 |
Source: Public Records
Map
Nearby Homes
- 1333 Craneing Rd
- 26982 Tungsten Rd
- 28030 Coolidge Dr
- 1670 Hillandale Dr
- 26268 Leslie Ave
- 780 E 266th St
- 755 E 266th St
- 825 E 256th St
- 28900 Euclid Ave
- 712 E 266th St
- 754 E 256th St
- 28886 Hazel Ave
- 670 Hemlock Dr
- 635 E 261st St
- 640 E 261st St
- 630 Birch Ave
- 26471 Farringdon Ave
- 25530 Richards Ave
- 25700 Briardale Ave
- 1507 E 256th St
- 27801 Mills Ave Unit 3K
- 27801 Mills Ave Unit I3
- 27801 Mills Ave Unit N
- 27801 Mills Ave Unit B
- 27801 Mills Ave
- 27801 Mills Ave
- 27801 Mills Ave Unit 3C
- 27801 Mills Ave Unit 3M
- 27801 Mills Ave Unit 3E
- 27801 Mills Ave
- 27801 Mills Ave
- 27801 Mills Ave
- 27801 Mills Ave Unit 3J
- 27801 Mills Ave Unit 3H
- 27801 Mills Ave Unit J
- 27801 Mills Ave Unit I
- 27801 Mills Ave Unit 3N
- 27801 Mills Ave Unit 3L
- 27701 Mills Ave Unit 2P
- 27701 Mills Ave Unit D2