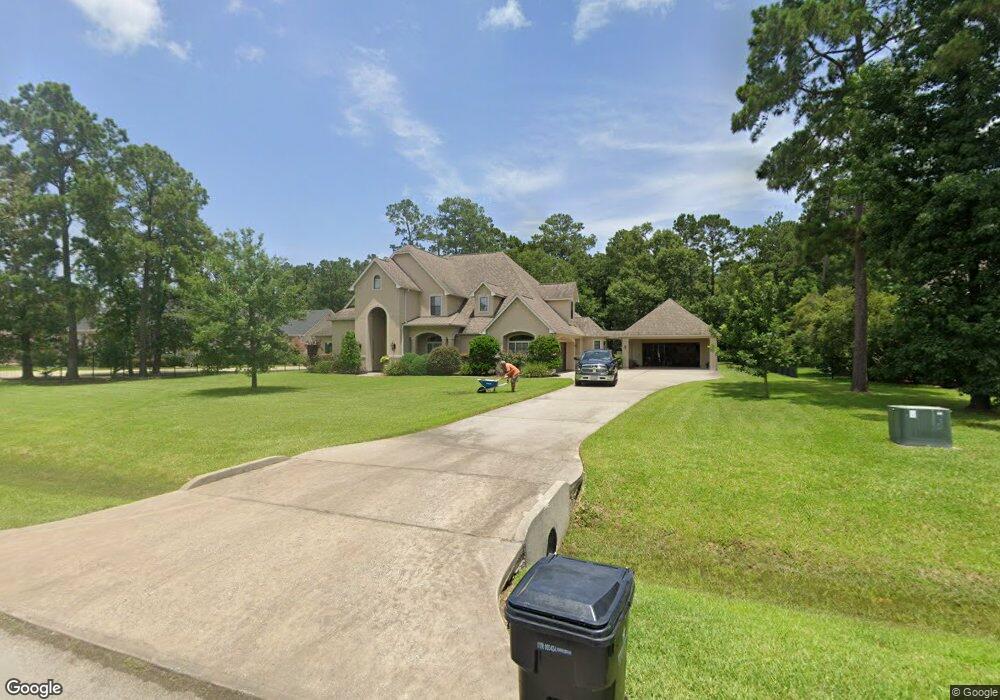
27802 Newport Ln Spring, TX 77386
Benders Landing NeighborhoodEstimated Value: $1,030,000 - $1,248,000
Studio
1
Bath
4,822
Sq Ft
$234/Sq Ft
Est. Value
About This Home
This home is located at 27802 Newport Ln, Spring, TX 77386 and is currently estimated at $1,129,453, approximately $234 per square foot. 27802 Newport Ln is a home located in Montgomery County with nearby schools including York J High School and Grand Oaks High School.
Ownership History
Date
Name
Owned For
Owner Type
Purchase Details
Closed on
Jan 9, 2013
Sold by
Bastian Vanessa and Whitley Vanessa
Bought by
Bastian Vanessa Whitley and Bastian David Gerard
Current Estimated Value
Home Financials for this Owner
Home Financials are based on the most recent Mortgage that was taken out on this home.
Original Mortgage
$251,600
Outstanding Balance
$173,860
Interest Rate
3.39%
Mortgage Type
New Conventional
Estimated Equity
$955,593
Purchase Details
Closed on
Dec 20, 2007
Sold by
Bastian Vanessa and Bastian Vanessa Whitlet
Bought by
Bastian David Gerard
Home Financials for this Owner
Home Financials are based on the most recent Mortgage that was taken out on this home.
Original Mortgage
$261,740
Interest Rate
6.26%
Mortgage Type
Construction
Purchase Details
Closed on
Jul 10, 2006
Sold by
Lgi Land Llc
Bought by
Bastian David Gerard and Bastian Vanessa
Create a Home Valuation Report for This Property
The Home Valuation Report is an in-depth analysis detailing your home's value as well as a comparison with similar homes in the area
Home Values in the Area
Average Home Value in this Area
Purchase History
| Date | Buyer | Sale Price | Title Company |
|---|---|---|---|
| Bastian Vanessa Whitley | -- | None Available | |
| Bastian David Gerard | -- | American Title Co | |
| Bastian David Gerard | -- | -- | |
| Bastain Vanessa | -- | American Title Co |
Source: Public Records
Mortgage History
| Date | Status | Borrower | Loan Amount |
|---|---|---|---|
| Open | Bastian Vanessa Whitley | $251,600 | |
| Closed | Bastian David Gerard | $261,740 |
Source: Public Records
Tax History
| Year | Tax Paid | Tax Assessment Tax Assessment Total Assessment is a certain percentage of the fair market value that is determined by local assessors to be the total taxable value of land and additions on the property. | Land | Improvement |
|---|---|---|---|---|
| 2025 | $10,314 | $1,046,289 | -- | -- |
| 2024 | $11,323 | $951,172 | -- | -- |
| 2023 | $11,323 | $864,700 | $209,000 | $729,580 |
| 2022 | $13,639 | $786,090 | $189,230 | $630,770 |
| 2021 | $13,211 | $714,630 | $115,380 | $599,250 |
| 2020 | $12,889 | $662,960 | $115,380 | $547,580 |
| 2019 | $15,867 | $787,690 | $137,150 | $650,540 |
| 2018 | $13,906 | $749,500 | $137,150 | $612,350 |
| 2017 | $15,077 | $749,500 | $137,150 | $612,350 |
| 2016 | $14,483 | $719,950 | $137,150 | $582,800 |
| 2015 | $13,392 | $737,850 | $137,150 | $686,320 |
| 2014 | $13,392 | $670,770 | $93,610 | $608,430 |
Source: Public Records
Map
Nearby Homes
- 28110 Whispering Maple Way
- 4938 Northern Woods Dr
- 28002 Whispering Maple Way
- 4911 Ontonagon Way
- 27806 Quiet Sky Place Dr
- 4115 Flagstone Pine Ln
- 4510 Siandra Creek Ct
- 27515 Siandra Creek Ln
- 5346 Pine Wood Hills Ct
- 4502 Siandra Creek Ct
- 5342 Pine Wood Hills Ct
- 27506 Canton Acres Ct
- 27910 Hansons Ct
- 27626 S Colt Shadow Ln
- 5519 Bright Timber Landing Dr
- 27318 Blue Cedar Ln
- 27303 Siandra Creek Ln
- 6007 N Ossineke Dr
- 27403 W Balsam Fir Cir
- 27430 Whispering Maple Way
- 27714 Newport Ln
- 27806 Newport Ln
- 27710 Newport Ln
- 27810 Newport Ln
- 27803 Ossineke Dr
- 5015 Newport Ct
- 27807 Ossineke Dr
- 27719 Ossineke Dr
- 27719 Ossineke Dr
- 27723 Ossineke Dr
- 27706 Newport Ln
- 27814 Newport Ln
- 27811 Ossineke Dr
- 5011 Newport Ct
- 5014 Newport Ct
- 5014 Newport Ct
- 27711 Ossineke Dr
- 27702 Newport Ln
- 5203 Pine Wood Meadows Ln
- 5103 Pine Wood Meadows Ln
Your Personal Tour Guide
Ask me questions while you tour the home.