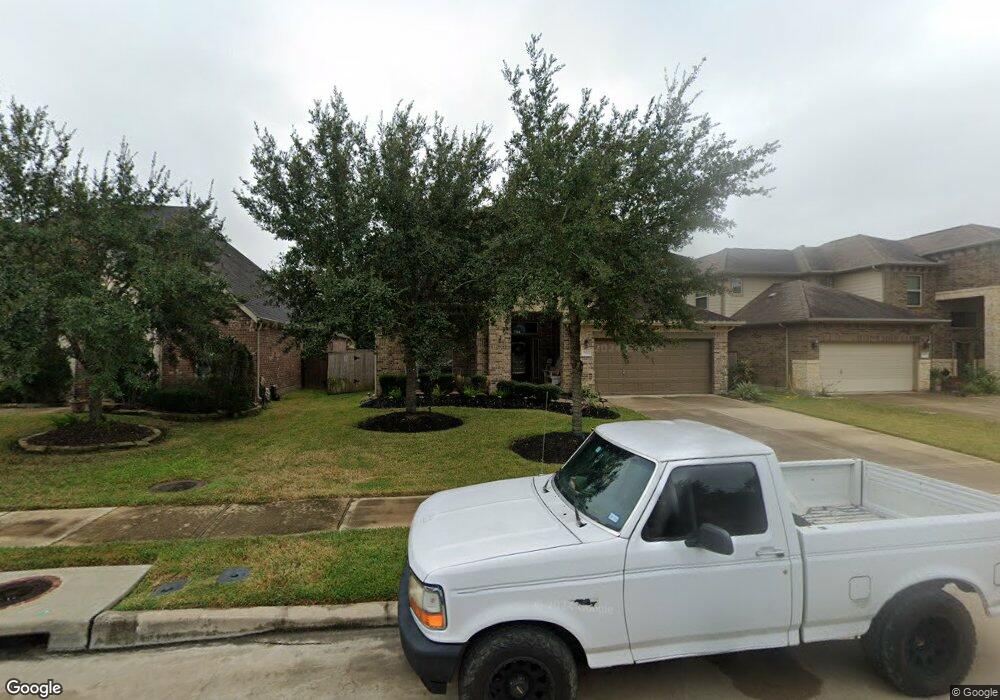
27803 Ashbrook Falls Ct Fulshear, TX 77441
Estimated Value: $526,000 - $598,000
4
Beds
4
Baths
3,483
Sq Ft
$159/Sq Ft
Est. Value
About This Home
This home is located at 27803 Ashbrook Falls Ct, Fulshear, TX 77441 and is currently estimated at $553,714, approximately $158 per square foot. 27803 Ashbrook Falls Ct is a home located in Fort Bend County with nearby schools including Campbell Elementary School, Joe M. Adams Junior High, and Sugar Creek Montessori - Fulshear/West Katy.
Ownership History
Date
Name
Owned For
Owner Type
Purchase Details
Closed on
Jul 13, 2017
Sold by
Rajusjatha Gowthaman and Hakeem Thasneem Abdul
Bought by
Zapata Ryan and Zapata Michelle
Current Estimated Value
Home Financials for this Owner
Home Financials are based on the most recent Mortgage that was taken out on this home.
Original Mortgage
$299,275
Outstanding Balance
$248,988
Interest Rate
3.94%
Mortgage Type
VA
Estimated Equity
$304,726
Purchase Details
Closed on
Sep 22, 2014
Sold by
Taylor Morrison Of Texas Inc
Bought by
Rajusujatha Gowthaman and Hakeem Thasneem Abdul
Home Financials for this Owner
Home Financials are based on the most recent Mortgage that was taken out on this home.
Original Mortgage
$291,609
Interest Rate
4.18%
Mortgage Type
New Conventional
Purchase Details
Closed on
Apr 10, 2013
Sold by
Taylor Morrison Of Texas Inc
Bought by
Zapata Ryan and Zapata Michelle
Create a Home Valuation Report for This Property
The Home Valuation Report is an in-depth analysis detailing your home's value as well as a comparison with similar homes in the area
Home Values in the Area
Average Home Value in this Area
Purchase History
| Date | Buyer | Sale Price | Title Company |
|---|---|---|---|
| Zapata Ryan | -- | None Available | |
| Rajusujatha Gowthaman | -- | Stewart Title | |
| Zapata Ryan | -- | -- | |
| Zapata Ryan | -- | -- |
Source: Public Records
Mortgage History
| Date | Status | Borrower | Loan Amount |
|---|---|---|---|
| Open | Zapata Ryan | $299,275 | |
| Previous Owner | Zapata Ryan | $291,609 |
Source: Public Records
Tax History Compared to Growth
Tax History
| Year | Tax Paid | Tax Assessment Tax Assessment Total Assessment is a certain percentage of the fair market value that is determined by local assessors to be the total taxable value of land and additions on the property. | Land | Improvement |
|---|---|---|---|---|
| 2025 | $9,060 | $491,379 | $78,650 | $440,647 |
| 2024 | $9,060 | $446,708 | -- | $460,026 |
| 2023 | $9,060 | $406,098 | $0 | $460,558 |
| 2022 | $9,085 | $369,180 | $0 | $407,270 |
| 2021 | $9,647 | $335,620 | $60,500 | $275,120 |
| 2020 | $9,949 | $339,330 | $55,000 | $284,330 |
| 2019 | $10,599 | $338,560 | $55,000 | $283,560 |
| 2018 | $10,240 | $326,570 | $55,000 | $271,570 |
| 2017 | $10,251 | $326,390 | $55,000 | $271,390 |
| 2016 | $11,044 | $351,660 | $55,000 | $296,660 |
| 2015 | $6,399 | $338,010 | $55,000 | $283,010 |
| 2014 | $871 | $41,250 | $41,250 | $0 |
Source: Public Records
Map
Nearby Homes
- 27830 Hunters Rock Ln
- 27834 Hunters Rock Ln
- 3422 Walker Falls Ln
- 3314 Flint Valley Ln
- 3438 Cartwright Cliff Ln
- 27719 Merchant Hills Ln
- 28131 Twin Knolls Ln
- 27603 Huggins Crest Ct
- 27414 Hollow Pass Ln
- 27803 Indigo Pointe Ln
- 3710 Meadowmist Ct
- 27423 Sunrise Ranch Ln
- 27514 Wilson Run Ln
- 27615 Brentsprings Run Ln
- 27419 Canyon Reach Dr
- 3523 Shearwater St
- 27411 Canyon Reach Dr
- 27414 Wooded Canyon Dr
- 3527 Shearwater St
- 3535 Blue Mockingbird St
- 27803 Ashbrook Falls
- 27811 Ashbrook Falls
- 27723 Ashbrook Falls Ct
- 27807 Ashbrook Falls Ct
- 27719 Ashbrook Falls Ct
- 27802 Halls Farms Ln
- 27806 Halls Farms Ln
- 27802 Ashbrook Falls Ct
- 27730 Halls Farms Ln
- 27722 Ashbrook Falls Ct
- 27810 Halls Farms Ln
- 27726 Halls Farms Ln
- 27715 Ashbrook Falls Ct
- 27815 Ashbrook Falls Ct
- 27806 Ashbrook Falls Ct
- 27810 Ashbrook Falls Ct
- 27718 Ashbrook Falls Ct
- 27722 Halls Farms Ln
- 27814 Halls Farms Ln
- 27711 Ashbrook Falls Ct