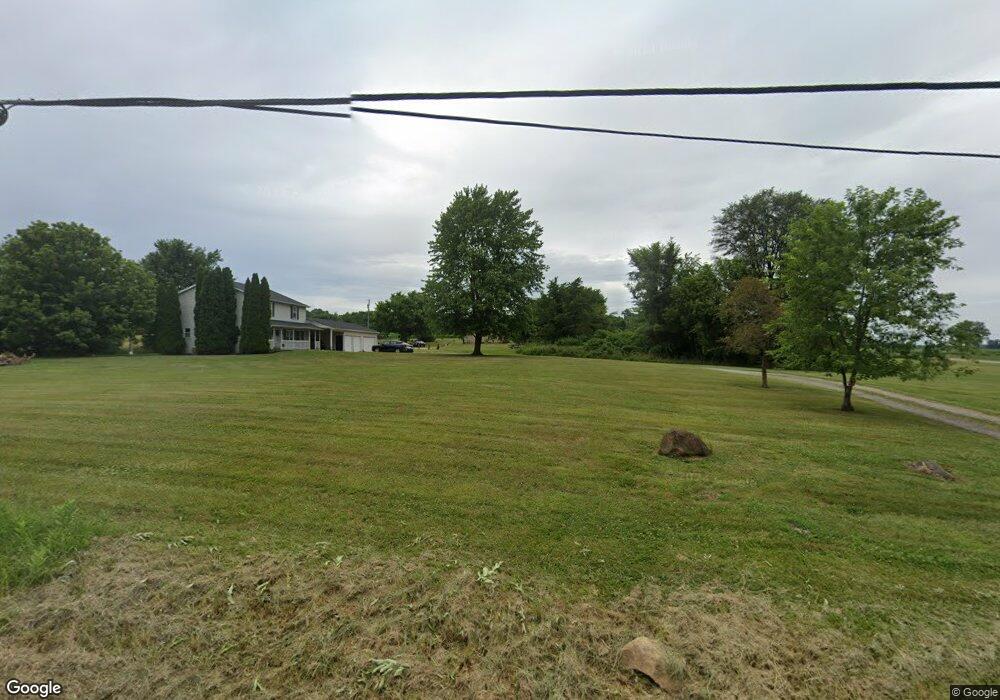
2781 Mount Pleasant St NE Canton, OH 44721
Estimated Value: $242,000 - $276,570
4
Beds
4
Baths
1,904
Sq Ft
$137/Sq Ft
Est. Value
About This Home
This home is located at 2781 Mount Pleasant St NE, Canton, OH 44721 and is currently estimated at $260,143, approximately $136 per square foot. 2781 Mount Pleasant St NE is a home located in Stark County with nearby schools including Middlebranch Elementary School, Oakwood Middle School, and GlenOak High School.
Ownership History
Date
Name
Owned For
Owner Type
Purchase Details
Closed on
Jan 7, 2022
Sold by
Wolfe Gregory and Wolfe Greg
Bought by
Hall Of Fame Rentals Llc
Current Estimated Value
Purchase Details
Closed on
Apr 28, 2021
Sold by
Wolfe Greg and Wolfe Rebecca
Bought by
Wolfe Greg
Purchase Details
Closed on
Jul 30, 2015
Sold by
Sowers Lisa
Bought by
Wolfe Gregory and Wolfe Rebeeca
Home Financials for this Owner
Home Financials are based on the most recent Mortgage that was taken out on this home.
Original Mortgage
$87,375
Interest Rate
3.84%
Mortgage Type
New Conventional
Purchase Details
Closed on
Jun 6, 1996
Sold by
N & L 3 Ltd Ptns
Bought by
Yannesse James
Home Financials for this Owner
Home Financials are based on the most recent Mortgage that was taken out on this home.
Original Mortgage
$78,000
Interest Rate
7.97%
Mortgage Type
New Conventional
Create a Home Valuation Report for This Property
The Home Valuation Report is an in-depth analysis detailing your home's value as well as a comparison with similar homes in the area
Home Values in the Area
Average Home Value in this Area
Purchase History
| Date | Buyer | Sale Price | Title Company |
|---|---|---|---|
| Hall Of Fame Rentals Llc | -- | None Available | |
| Wolfe Greg | -- | Patriot Title Agency Inc | |
| Wolfe Gregory | $116,500 | Attorney | |
| Yannesse James | $104,500 | -- |
Source: Public Records
Mortgage History
| Date | Status | Borrower | Loan Amount |
|---|---|---|---|
| Previous Owner | Wolfe Gregory | $87,375 | |
| Previous Owner | Yannesse James | $78,000 |
Source: Public Records
Tax History Compared to Growth
Tax History
| Year | Tax Paid | Tax Assessment Tax Assessment Total Assessment is a certain percentage of the fair market value that is determined by local assessors to be the total taxable value of land and additions on the property. | Land | Improvement |
|---|---|---|---|---|
| 2025 | $2,030 | $72,910 | $35,320 | $37,590 |
| 2024 | -- | $72,910 | $35,320 | $37,590 |
| 2023 | $4,763 | $70,630 | $21,000 | $49,630 |
| 2022 | $2,966 | $70,630 | $21,000 | $49,630 |
| 2021 | $2,977 | $70,630 | $21,000 | $49,630 |
| 2020 | $2,851 | $61,260 | $18,100 | $43,160 |
| 2019 | $2,826 | $58,490 | $19,430 | $39,060 |
| 2018 | $2,663 | $58,490 | $19,430 | $39,060 |
| 2017 | $2,105 | $43,050 | $14,000 | $29,050 |
| 2016 | $2,109 | $43,050 | $14,000 | $29,050 |
| 2015 | $2,114 | $65,460 | $19,260 | $46,200 |
| 2014 | $1,298 | $64,510 | $19,010 | $45,500 |
| 2013 | $334 | $64,510 | $19,010 | $45,500 |
Source: Public Records
Map
Nearby Homes
- 8418 Fernie Ave NE
- Elder Plan at Sparwood Farms
- Aspen Plan at Sparwood Farms
- Tupelo Plan at Sparwood Farms
- Spruce Plan at Sparwood Farms
- Cedar Plan at Sparwood Farms
- 8314 Sapphire Ave NE
- 2414 Mount Pleasant St NE
- 2623 Notre Dame St NE
- 2518 Jasper St NE
- 2501 Captens St NE Unit 31
- 3064 Diamond St NE
- 3404 Wicker St NE
- 7606 Knollridge Ave NE
- 3151 Knollridge Cir NE
- 7431 Middlebranch Ave NE
- 3339 Boettler St NE
- 7192 Middlebranch Ave NE
- 7875 Bentler Ave NE
- 7606 Woodcrest Ave NE
- 2783 Mount Pleasant St NE
- 2787 Mount Pleasant St NE
- 2714 Mount Pleasant St NE
- 2669 Mount Pleasant St NE
- 8480 Middlebranch Ave NE
- 8451 Middlebranch Ave NE
- 2631 Mount Pleasant St NE
- 8700 Lost Trail Ave NE
- 8399 Middlebranch Ave NE
- 8722 Lost Trail Ave NE
- 2893 Mount Pleasant St NE
- 2580 Mount Pleasant St NE
- 2928 Mount Pleasant St NE
- 2931 Mount Pleasant St NE
- 8731 Middlebranch Ave NE
- 8746 Lost Trail Ave NE
- 8735 Lost Trail Ave NE
- 8753 Middlebranch Ave NE
- 8345 Middlebranch Ave NE
- 8713 Lost Trail Ave NE