L
Landlord's Agent in 2025
Lisa Hillman
john greene Realtor
(630) 276-8455
3 in this area
72 Total Sales
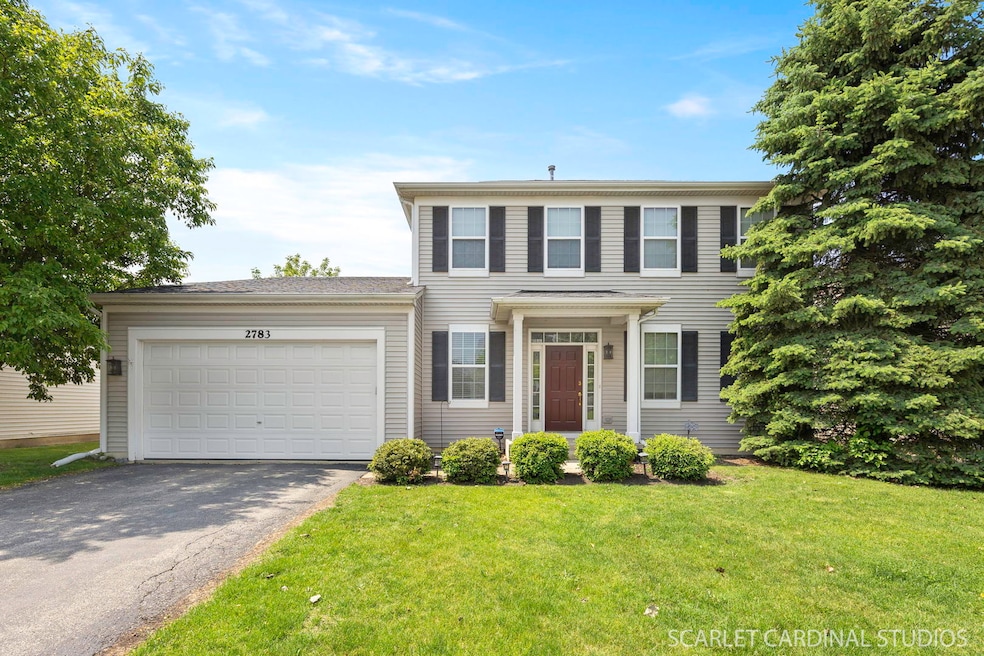
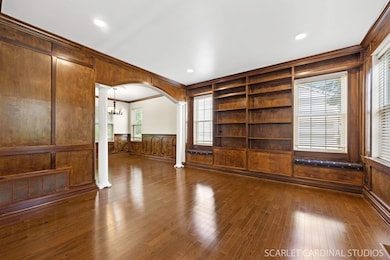
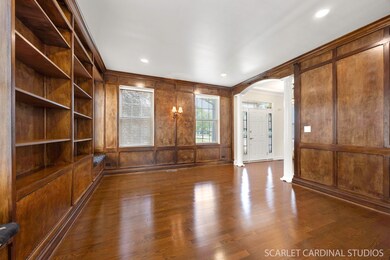
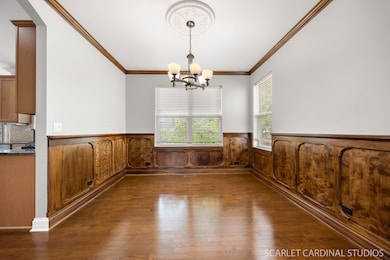
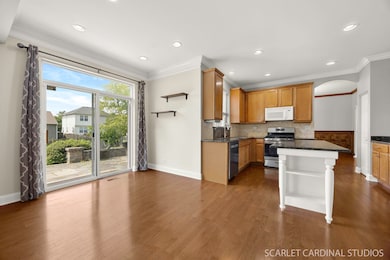
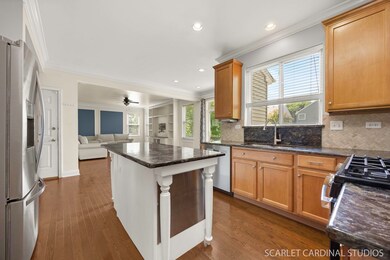
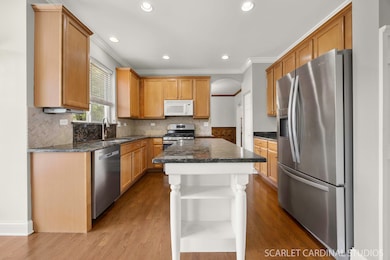
Spacious 3 bedroom, 2.1 bath home with finished basement and fenced yard in Homestead subdivision available now! Over 2,000 sq feet of living space. Updated kitchen with granite counters, island, and stainless appliances opens to large family room with built-ins and abundant natural light. Formal living and dining rooms feature custom woodwork. 3 large bedrooms and two full baths on second floor AND washer and dryer located on 2nd floor. Finished basement includes unique brick-arched hallway and flexible space for rec room, home office, and hidden storage behind a decorative wall. Fully fenced backyard with large paver patio, perfect for outdoor entertaining. Oswego School District 308: Homestead Elementary, Bednarcik Junior High, Oswego East High School. 2-car garage. Minimum 600 credit score required. 1-year minimum lease. Dogs considered case-by-case with $500 non-refundable pet deposit and $50/month pet rent. No smoking. Rent includes lawn care. Available now!
Last Agent to Rent the Property
john greene, Realtor License #475201532 Listed on: 06/09/2025

| Date | Buyer | Sale Price | Title Company |
|---|---|---|---|
| Flying Cloud Holdings Llc | -- | None Listed On Document | |
| Balauag Luis B | -- | Attorney | |
| Alaual Luis B | $233,000 | None Available | |
| Goddard Andrew S | $210,000 | Chicago Title Insurance Co |
| Date | Status | Borrower | Loan Amount |
|---|---|---|---|
| Previous Owner | Alaual Luis B | $221,350 | |
| Previous Owner | Goddard Andrew S | $189,000 | |
| Previous Owner | Goddard Andrew S | $167,656 | |
| Closed | Goddard Andrew S | $20,957 |
| Date | Event | Price | Change | Sq Ft Price |
|---|---|---|---|---|
| 08/04/2025 08/04/25 | Rented | $3,300 | -5.7% | -- |
| 07/08/2025 07/08/25 | Price Changed | $3,500 | -5.4% | $2 / Sq Ft |
| 06/20/2025 06/20/25 | Price Changed | $3,700 | -5.1% | $2 / Sq Ft |
| 06/09/2025 06/09/25 | For Rent | $3,900 | -2.5% | -- |
| 07/12/2024 07/12/24 | Rented | $4,000 | 0.0% | -- |
| 07/11/2024 07/11/24 | Under Contract | -- | -- | -- |
| 07/11/2024 07/11/24 | For Rent | $4,000 | 0.0% | -- |
| 10/05/2012 10/05/12 | Sold | $233,000 | -4.1% | $115 / Sq Ft |
| 09/06/2012 09/06/12 | Pending | -- | -- | -- |
| 07/13/2012 07/13/12 | For Sale | $242,900 | -- | $120 / Sq Ft |
| Year | Tax Paid | Tax Assessment Tax Assessment Total Assessment is a certain percentage of the fair market value that is determined by local assessors to be the total taxable value of land and additions on the property. | Land | Improvement |
|---|---|---|---|---|
| 2024 | $9,730 | $119,633 | $23,259 | $96,374 |
| 2023 | $9,730 | $105,683 | $20,547 | $85,136 |
| 2022 | $8,842 | $94,846 | $19,437 | $75,409 |
| 2021 | $8,784 | $90,329 | $18,511 | $71,818 |
| 2020 | $8,409 | $88,898 | $18,218 | $70,680 |
| 2019 | $8,778 | $86,393 | $17,705 | $68,688 |
| 2018 | $7,840 | $75,359 | $17,315 | $58,044 |
| 2017 | $7,769 | $73,414 | $16,868 | $56,546 |
| 2016 | $7,694 | $71,834 | $16,505 | $55,329 |
| 2015 | $7,051 | $69,071 | $15,870 | $53,201 |
| 2014 | $7,051 | $60,970 | $15,870 | $45,100 |
| 2013 | $7,051 | $60,970 | $15,870 | $45,100 |
L
Landlord's Agent in 2025
Lisa Hillman
john greene Realtor
(630) 276-8455
3 in this area
72 Total Sales
Tenant's Agent in 2025
Katie Fish
Keller Williams Inspire - Geneva
(847) 560-3474
2 in this area
336 Total Sales
E
Seller's Agent in 2012
Eric Rogers
Century 21 Circle - Aurora
D
Buyer's Agent in 2012
Debbie Camden
Coldwell Banker Residential
Source: Midwest Real Estate Data (MRED)
MLS Number: 12388980
APN: 07-01-06-407-014
Disclaimer: Certain information contained herein is derived from information provided by parties other than Homes.com. All information provided is deemed reliable, but is not guaranteed to be accurate and should be independently verified.
![]() Based on information submitted to the MLS GRID. All data is obtained from various sources and may not have been verified by broker or MLS GRID. Supplied Open House Information is subject to change without notice. All information should be independently reviewed and verified for accuracy. Properties may or may not be listed by the office/agent presenting the information. Some IDX listings have been excluded from this website.
Based on information submitted to the MLS GRID. All data is obtained from various sources and may not have been verified by broker or MLS GRID. Supplied Open House Information is subject to change without notice. All information should be independently reviewed and verified for accuracy. Properties may or may not be listed by the office/agent presenting the information. Some IDX listings have been excluded from this website.
The Digital Millennium Copyright Act of 1998, 17 U.S.C. § 512 (the “DMCA”) provides recourse for copyright owners who believe that material appearing on the Internet infringes their rights under U.S. copyright law. If you believe in good faith that any content or material made available in connection with our website or services infringes your copyright, you (or your agent) may send us a notice requesting that the content or material be removed, or access to it blocked.
Notices must be sent in writing by email to DMCAnotice@MLSGrid.com.
The DMCA requires that your notice of alleged copyright infringement include the following information:
(1) description of the copyrighted work that is the subject of claimed infringement;
(2) description of the alleged infringing content and information sufficient to permit us to locate the content;
(3) contact information for you, including your address, telephone number and email address;
(4) a statement by you that you have a good faith belief that the content in the manner complained of is not authorized by the copyright owner, or its agent, or by the operation of any law;
(5) a statement by you, signed under penalty of perjury, that the information in the notification is accurate and that you have the authority to enforce the copyrights that are claimed to be infringed; and
(6) a physical or electronic signature of the copyright owner or a person authorized to act on the copyright owner’s behalf. Failure to include all of the above information may result in the delay of the processing of your complaint.