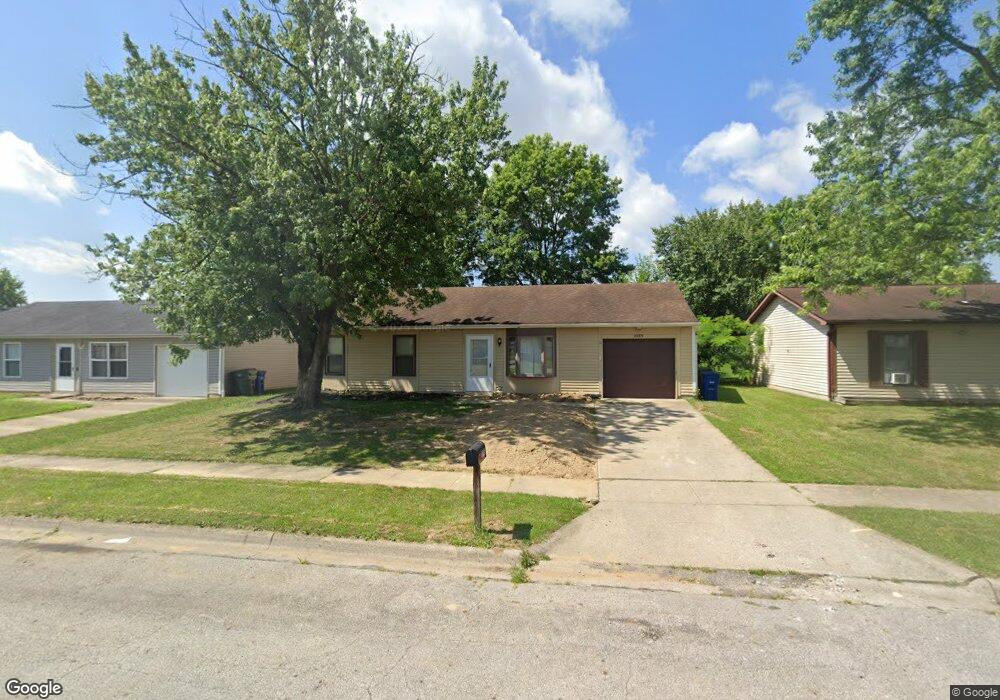
2783 Millrace Dr Columbus, OH 43207
Obetz-Lockbourne NeighborhoodEstimated Value: $200,780 - $223,000
3
Beds
2
Baths
1,008
Sq Ft
$212/Sq Ft
Est. Value
About This Home
This home is located at 2783 Millrace Dr, Columbus, OH 43207 and is currently estimated at $213,195, approximately $211 per square foot. 2783 Millrace Dr is a home located in Franklin County with nearby schools including Groveport Madison High School, South Columbus Preparatory Academy at Southfield, and Groveport Community School.
Ownership History
Date
Name
Owned For
Owner Type
Purchase Details
Closed on
Sep 1, 2015
Sold by
Dawson Steven W and Dawson Joyee A
Bought by
Integrity Home Rentals Iillc
Current Estimated Value
Purchase Details
Closed on
Aug 31, 2015
Sold by
Dawson Steven W and Dawson Joyce A
Bought by
Integrity Home Rentals Ii Llc
Purchase Details
Closed on
May 1, 2013
Sold by
Dawson Steven W and Dawson Joyce A
Bought by
Dawson Steven W and Dawson Joyce A
Purchase Details
Closed on
Jun 20, 2003
Sold by
Hughes M Diana and Hughes Lawrence L
Bought by
Dawson Steven W and Dawson Joyce A
Home Financials for this Owner
Home Financials are based on the most recent Mortgage that was taken out on this home.
Original Mortgage
$71,900
Interest Rate
5.4%
Mortgage Type
Purchase Money Mortgage
Purchase Details
Closed on
May 21, 1990
Purchase Details
Closed on
May 1, 1980
Create a Home Valuation Report for This Property
The Home Valuation Report is an in-depth analysis detailing your home's value as well as a comparison with similar homes in the area
Home Values in the Area
Average Home Value in this Area
Purchase History
| Date | Buyer | Sale Price | Title Company |
|---|---|---|---|
| Integrity Home Rentals Iillc | $45,700 | None Available | |
| Integrity Home Rentals Ii Llc | $45,700 | Valmer Land Title Agency Box | |
| Dawson Steven W | -- | None Available | |
| Dawson Steven W | $89,900 | Columbus Title Agency Inc | |
| -- | $54,900 | -- | |
| -- | $40,800 | -- |
Source: Public Records
Mortgage History
| Date | Status | Borrower | Loan Amount |
|---|---|---|---|
| Previous Owner | Dawson Steven W | $71,900 |
Source: Public Records
Tax History Compared to Growth
Tax History
| Year | Tax Paid | Tax Assessment Tax Assessment Total Assessment is a certain percentage of the fair market value that is determined by local assessors to be the total taxable value of land and additions on the property. | Land | Improvement |
|---|---|---|---|---|
| 2024 | $3,639 | $56,070 | $19,250 | $36,820 |
| 2023 | $2,411 | $56,070 | $19,250 | $36,820 |
| 2022 | $952 | $18,420 | $7,740 | $10,680 |
| 2021 | $955 | $18,420 | $7,740 | $10,680 |
| 2020 | $957 | $18,420 | $7,740 | $10,680 |
| 2019 | $929 | $16,000 | $6,720 | $9,280 |
| 2018 | $1,288 | $16,000 | $6,720 | $9,280 |
| 2017 | $1,328 | $25,240 | $6,720 | $18,520 |
| 2016 | $1,120 | $16,000 | $5,110 | $10,890 |
| 2015 | $1,640 | $24,430 | $5,110 | $19,320 |
| 2014 | $1,564 | $24,430 | $5,110 | $19,320 |
| 2013 | $756 | $25,725 | $5,390 | $20,335 |
Source: Public Records
Map
Nearby Homes
- 3865 Pendent Ln
- 2585 Millview Dr
- 0 Alum Creek Dr Unit 225007823
- 2587 Winningwillow Dr
- 3724 Revolutionary Dr Unit 111
- 3622 Pendent Ln
- 2629 Patrick Henry Ave Unit 40
- 2318 Rodger Rd
- 2229 Maureen Blvd N
- 2222 Maureen Blvd S
- 4310 Charlotte Rd
- 2697 Meigs Dr
- 3242 Mackinac Dr
- 2693 Meigs Dr
- 2689 Meigs Dr
- 2685 Meigs Dr
- 2681 Meigs Dr
- 2690 Meigs Dr
- 2686 Meigs Dr
- 2682 Meigs Dr
- 2775 Millrace Dr
- 2793 Millrace Dr
- 2767 Millrace Dr
- 2801 Millrace Dr
- 2756 Moonlight Ln
- 2762 Moonlight Ln
- 2770 Moonlight Ln
- 2748 Moonlight Ln
- 2759 Millrace Dr
- 2809 Millrace Dr
- 2778 Moonlight Ln
- 2774 Millrace Dr
- 2798 Millrace Dr
- 2790 Millrace Dr
- 2806 Millrace Dr
- 2740 Moonlight Ln
- 2751 Millrace Dr
- 2766 Millrace Dr
- 2786 Moonlight Ln
- 2812 Millrace Dr