2784 Chateau Cir S Unit 44 Columbus, OH 43221
Estimated Value: $229,964 - $256,000
2
Beds
2
Baths
1,088
Sq Ft
$224/Sq Ft
Est. Value
About This Home
This home is located at 2784 Chateau Cir S Unit 44, Columbus, OH 43221 and is currently estimated at $243,491, approximately $223 per square foot. 2784 Chateau Cir S Unit 44 is a home located in Franklin County with nearby schools including Tremont Elementary School, Jones Middle School, and Upper Arlington High School.
Ownership History
Date
Name
Owned For
Owner Type
Purchase Details
Closed on
Jul 30, 2015
Sold by
Steffan Joyce
Bought by
Finelli Taryn B
Current Estimated Value
Home Financials for this Owner
Home Financials are based on the most recent Mortgage that was taken out on this home.
Original Mortgage
$100,400
Outstanding Balance
$79,098
Interest Rate
4.08%
Mortgage Type
New Conventional
Estimated Equity
$164,393
Purchase Details
Closed on
Jun 15, 2004
Sold by
Johnson Ernest E
Bought by
Steffan Joyce
Home Financials for this Owner
Home Financials are based on the most recent Mortgage that was taken out on this home.
Original Mortgage
$108,000
Interest Rate
5.5%
Mortgage Type
Purchase Money Mortgage
Purchase Details
Closed on
May 21, 1981
Bought by
Johnson Ernest E
Create a Home Valuation Report for This Property
The Home Valuation Report is an in-depth analysis detailing your home's value as well as a comparison with similar homes in the area
Home Values in the Area
Average Home Value in this Area
Purchase History
| Date | Buyer | Sale Price | Title Company |
|---|---|---|---|
| Finelli Taryn B | $125,000 | Golden Title | |
| Steffan Joyce | $123,000 | Stewart Tit | |
| Johnson Ernest E | -- | -- |
Source: Public Records
Mortgage History
| Date | Status | Borrower | Loan Amount |
|---|---|---|---|
| Open | Finelli Taryn B | $100,400 | |
| Previous Owner | Steffan Joyce | $108,000 |
Source: Public Records
Tax History Compared to Growth
Tax History
| Year | Tax Paid | Tax Assessment Tax Assessment Total Assessment is a certain percentage of the fair market value that is determined by local assessors to be the total taxable value of land and additions on the property. | Land | Improvement |
|---|---|---|---|---|
| 2024 | $3,915 | $67,620 | $23,100 | $44,520 |
| 2023 | $3,866 | $67,620 | $23,100 | $44,520 |
| 2022 | $3,615 | $51,740 | $9,420 | $42,320 |
| 2021 | $3,200 | $51,740 | $9,420 | $42,320 |
| 2020 | $3,172 | $51,740 | $9,420 | $42,320 |
| 2019 | $2,872 | $41,410 | $7,530 | $33,880 |
| 2018 | $2,635 | $41,410 | $7,530 | $33,880 |
| 2017 | $2,849 | $41,410 | $7,530 | $33,880 |
| 2016 | $2,416 | $36,540 | $6,510 | $30,030 |
| 2015 | $2,414 | $36,540 | $6,510 | $30,030 |
| 2014 | $2,417 | $36,540 | $6,510 | $30,030 |
| 2013 | $1,411 | $40,600 | $7,245 | $33,355 |
Source: Public Records
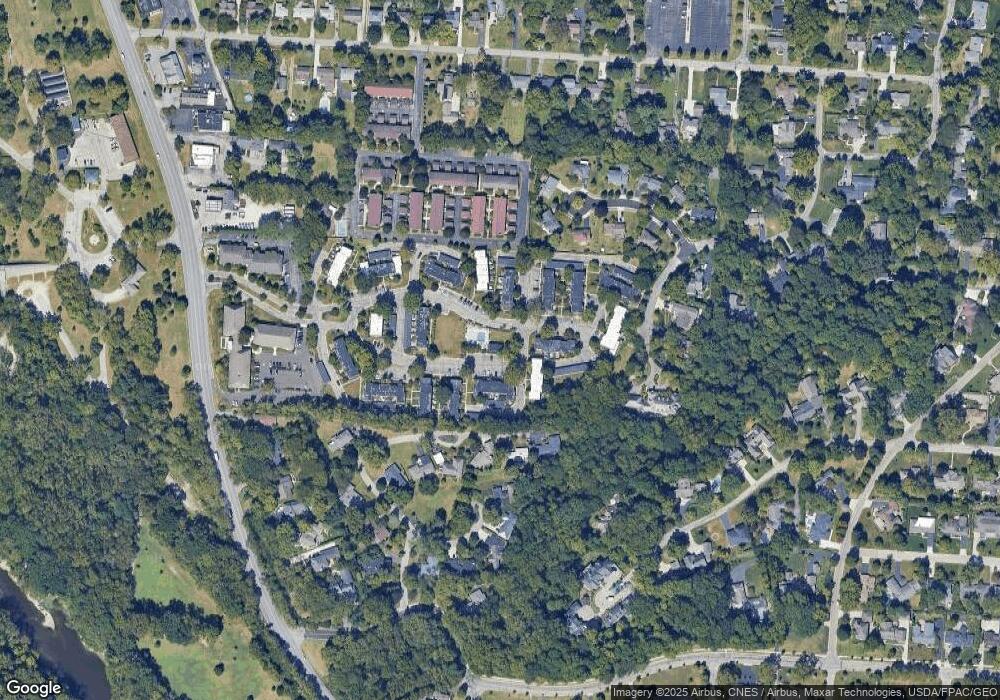
Map
Nearby Homes
- 2782 Chateau Cir S Unit 45
- 2785 Chateau Cir Unit 69
- 3190 Kioka Ave
- 2729 Eastcleft Dr
- 3163 S Dorchester Rd
- 2438 Sherwood Villa Unit 5
- 2594 Scioto View Ln Unit 2594
- 2370 Zollinger Rd
- 2979 Avalon Rd
- 3278 Brookview Way Unit 4
- 3161 Avalon Rd
- 2380 Quarry Trails Dr
- 2424 Quarry Trails Dr
- 2512 Quarry Trails Dr
- 2368 Quarry Trails Dr
- 2456 Quarry Trails Dr
- 2698 Shrewsbury Rd
- 2227 Zollinger Rd
- 2745 Cranford Rd
- 2443 Shrewsbury Rd
- 2782 Chateau Cir S
- 2782 Chateau Cir S Unit Carpo
- 2786 Chateau Cir S Unit 43
- 2788 Chateau Cir S
- 2788 Chateau Cir S Unit 42
- 2780 Chateau Cir S Unit 46
- 2790 Chateau Cir S
- 2809 Chateau Cir S Unit 35
- 2811 Chateau Cir
- 2811 Chateau Cir Unit 36
- 2811 Chateau Cir S
- 2811 Chateau Cir S Unit 36
- 2797 Chateau Cir Unit 51
- 2813 Chateau Cir S
- 2813 Chateau Cir S Unit 4
- 2795 Chateau Cir Unit 50
- 2793 Chateau Cir
- 2793 Chateau Cir Unit 49
- 2791 Chateau Cir Unit 48
- 2815 Chateau Cir S Unit 38