2785 Gateview Ct Unit 136 Cumming, GA 30040
Estimated Value: $421,000 - $471,000
3
Beds
3
Baths
2,164
Sq Ft
$207/Sq Ft
Est. Value
About This Home
This home is located at 2785 Gateview Ct Unit 136, Cumming, GA 30040 and is currently estimated at $448,490, approximately $207 per square foot. 2785 Gateview Ct Unit 136 is a home located in Forsyth County with nearby schools including George W. Whitlow Elementary School, Otwell Middle School, and Forsyth Central High School.
Ownership History
Date
Name
Owned For
Owner Type
Purchase Details
Closed on
Jul 15, 2016
Sold by
Murali
Bought by
Wentz Adam J and Wentz Kate
Current Estimated Value
Home Financials for this Owner
Home Financials are based on the most recent Mortgage that was taken out on this home.
Original Mortgage
$190,000
Outstanding Balance
$151,481
Interest Rate
3.54%
Estimated Equity
$297,009
Purchase Details
Closed on
Nov 16, 2013
Sold by
Inampudi Murali S
Bought by
Inampudi Murali and Inampudi Sowjanya
Purchase Details
Closed on
Jan 24, 2007
Sold by
R H Homes Dev Llc
Bought by
Inampudi Murali S
Home Financials for this Owner
Home Financials are based on the most recent Mortgage that was taken out on this home.
Original Mortgage
$196,400
Interest Rate
6.07%
Mortgage Type
FHA
Create a Home Valuation Report for This Property
The Home Valuation Report is an in-depth analysis detailing your home's value as well as a comparison with similar homes in the area
Home Values in the Area
Average Home Value in this Area
Purchase History
| Date | Buyer | Sale Price | Title Company |
|---|---|---|---|
| Wentz Adam J | $200,000 | -- | |
| Inampudi Murali | -- | -- | |
| Inampudi Murali S | $199,500 | -- |
Source: Public Records
Mortgage History
| Date | Status | Borrower | Loan Amount |
|---|---|---|---|
| Open | Wentz Adam J | $190,000 | |
| Previous Owner | Inampudi Murali S | $196,400 |
Source: Public Records
Tax History Compared to Growth
Tax History
| Year | Tax Paid | Tax Assessment Tax Assessment Total Assessment is a certain percentage of the fair market value that is determined by local assessors to be the total taxable value of land and additions on the property. | Land | Improvement |
|---|---|---|---|---|
| 2025 | $3,449 | $176,560 | $66,000 | $110,560 |
| 2024 | $3,449 | $167,612 | $66,000 | $101,612 |
| 2023 | $3,100 | $168,060 | $60,000 | $108,060 |
| 2022 | $3,248 | $111,964 | $32,000 | $79,964 |
| 2021 | $2,843 | $111,964 | $32,000 | $79,964 |
| 2020 | $2,695 | $104,816 | $32,000 | $72,816 |
| 2019 | $2,584 | $99,228 | $32,000 | $67,228 |
| 2018 | $2,534 | $96,560 | $32,000 | $64,560 |
| 2017 | $2,133 | $80,000 | $23,640 | $56,360 |
| 2016 | $2,254 | $81,204 | $24,000 | $57,204 |
| 2015 | $2,091 | $75,204 | $18,000 | $57,204 |
| 2014 | $1,676 | $63,296 | $0 | $0 |
Source: Public Records
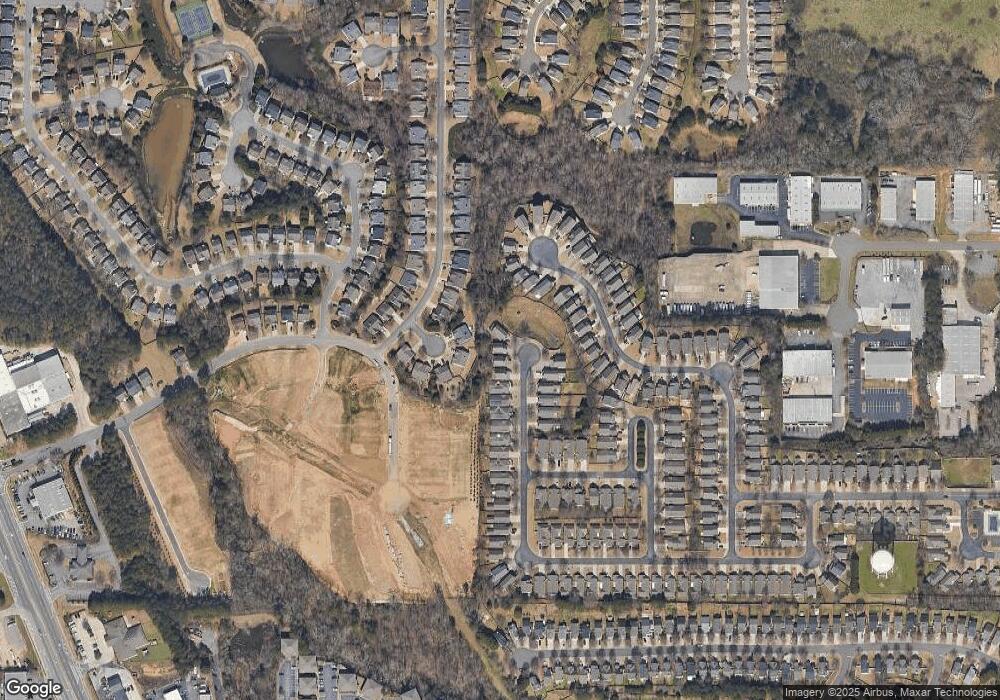
Map
Nearby Homes
- 6165 Bennett Pkwy
- 2545 Gatewater Ct
- 6330 Turfway Dr Unit II
- 6260 Sturbridge Ln
- 1404 Lexington Ln
- 5875 Weddington Dr
- 5510 Crestwick Way
- 5795 Asby Way
- 5825 Crestwick Way
- 5990 Wilmington Ct
- 4914 Sherwood Way
- 5314 Sherwood Way
- 4820 Oak Grove Dr
- 5310 Kings Common Way
- 5375 Hedgewick Way
- 4706 Piney Grove Rd
- 980 Patriot Trail
- 2785 Gateview Ct
- 2785 Gateview Ct Unit 2785
- 2775 Gateview Ct
- 2795 Gateview Ct
- 2765 Gateview Ct
- 6207 Wafare Cove Unit IA
- 2755 Gateview Ct
- 6211 Wafare Cove Unit 4
- 6211 Wafare Cove
- 2745 Gateview Ct
- 6220 Waveland Dr Unit 1A
- 2790 Gateview Ct Unit 2
- 6210 Waveland Dr
- 2735 Gateview Ct Unit 2
- 2780 Gateview Ct Unit 2
- 6210 Wafare Cove Unit IA
- 6230 Waveland Dr Unit IA
- 2845 Gatewater Ct
- 2845 Gatewater Ct Unit 58
- 2770 Gateview Ct