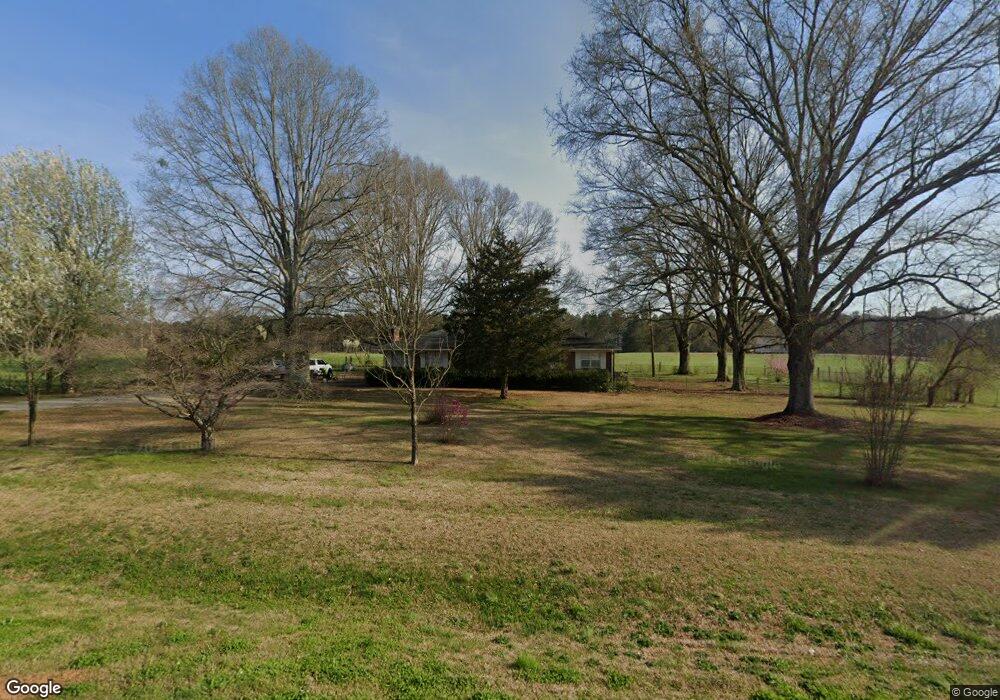
2785 Piedmont Hwy Cedartown, GA 30125
Estimated Value: $166,000 - $242,000
3
Beds
2
Baths
1,524
Sq Ft
$142/Sq Ft
Est. Value
About This Home
This home is located at 2785 Piedmont Hwy, Cedartown, GA 30125 and is currently estimated at $215,749, approximately $141 per square foot. 2785 Piedmont Hwy is a home located in Polk County.
Ownership History
Date
Name
Owned For
Owner Type
Purchase Details
Closed on
Sep 17, 2018
Sold by
Lorren Elmer Gordon
Bought by
Richardson Wanda R
Current Estimated Value
Home Financials for this Owner
Home Financials are based on the most recent Mortgage that was taken out on this home.
Original Mortgage
$70,300
Outstanding Balance
$61,179
Interest Rate
4.5%
Mortgage Type
New Conventional
Estimated Equity
$154,570
Purchase Details
Closed on
Feb 15, 2007
Sold by
Lorren Lorene B
Bought by
Lorren Elmer Gordon
Purchase Details
Closed on
Nov 28, 2006
Sold by
Not Provided
Bought by
Lorren Elmer Go and Douglas Mac Arthur Lorren
Purchase Details
Closed on
Apr 15, 1986
Bought by
Watson Charles Guy
Purchase Details
Closed on
Oct 12, 1985
Sold by
Watson Charles Guy
Bought by
Lorren Fred E
Purchase Details
Closed on
Nov 9, 1984
Sold by
Watson Charles Guy
Bought by
Watson Charles Guy
Purchase Details
Closed on
May 24, 1963
Bought by
Watson Charles Guy
Create a Home Valuation Report for This Property
The Home Valuation Report is an in-depth analysis detailing your home's value as well as a comparison with similar homes in the area
Home Values in the Area
Average Home Value in this Area
Purchase History
| Date | Buyer | Sale Price | Title Company |
|---|---|---|---|
| Richardson Wanda R | $74,000 | -- | |
| Lorren Elmer Gordon | -- | -- | |
| Lorren Lorene B | -- | -- | |
| Lorren Elmer Go | -- | -- | |
| Watson Charles Guy | -- | -- | |
| Lorren Fred E | -- | -- | |
| Watson Charles Guy | -- | -- | |
| Watson Charles Guy | -- | -- |
Source: Public Records
Mortgage History
| Date | Status | Borrower | Loan Amount |
|---|---|---|---|
| Open | Richardson Wanda R | $70,300 |
Source: Public Records
Tax History Compared to Growth
Tax History
| Year | Tax Paid | Tax Assessment Tax Assessment Total Assessment is a certain percentage of the fair market value that is determined by local assessors to be the total taxable value of land and additions on the property. | Land | Improvement |
|---|---|---|---|---|
| 2024 | $1,127 | $53,915 | $2,308 | $51,607 |
| 2023 | $834 | $35,138 | $2,308 | $32,830 |
| 2022 | $704 | $29,684 | $1,538 | $28,146 |
| 2021 | $714 | $29,684 | $1,538 | $28,146 |
| 2020 | $715 | $29,684 | $1,538 | $28,146 |
| 2019 | $697 | $25,954 | $1,538 | $24,416 |
| 2018 | $702 | $25,463 | $1,538 | $23,925 |
| 2017 | $693 | $25,463 | $1,538 | $23,925 |
| 2016 | $705 | $25,925 | $2,000 | $23,925 |
| 2015 | $708 | $25,948 | $2,000 | $23,948 |
| 2014 | $713 | $25,948 | $2,000 | $23,948 |
Source: Public Records
Map
Nearby Homes
- 745 Brewster Field Rd
- 812 Brewster Field Rd
- 1806 Piedmont Hwy
- 1810 Piedmont Hwy
- TR 2 Culp Lake Rd
- TR 3 Culp Lake Rd
- 0 Culp Lake Rd Unit 1025-K 10390361
- 0 Culp Lake Rd Unit 1025-J 10390355
- 0 Culp Lake Rd Unit 1025-I 10390347
- 0 Culp Lake Rd Unit 1025-H 10390344
- 0 Culp Lake Rd (Tract 3)
- 0 Culp Lake Rd (Tract 2)
- 35 Harris Loop
- 0 Cornelius Rd Unit 7646589
- 0 Treat Mountain Rd Unit 7643015
- 0 Treat Mountain Rd Unit 7634123
- 0 Treat Mountain Rd Unit 10586157
- 966 Judkin Mill Rd
- 0 Judkin Mill Rd Unit LotWP001 19369404
- 440 Treat Mountain Rd
- 2784 Piedmont Hwy
- 2776 Piedmont Hwy
- 2766 Piedmont Hwy
- 2741 Piedmont Hwy
- 2801 Piedmont Hwy
- 71 Cains Crossing
- 57 Cains Crossing
- 83 Cains Crossing
- 0 Cains Crossing Unit 7011523
- 0 Cains Crossing Unit 3213958
- 0 Cains Crossing Unit 8845367
- 0 Cains Crossing Unit 8534234
- 0 Cains Crossing Unit 8349856
- 0 Cains Crossing Unit 8181171
- 0 Cains Crossing Unit 3190140
- 0 Cains Crossing
- 45 Cains Crossing
- 95 Cains Crossing
- 78 Cains Crossing
- 64 Cains Crossing