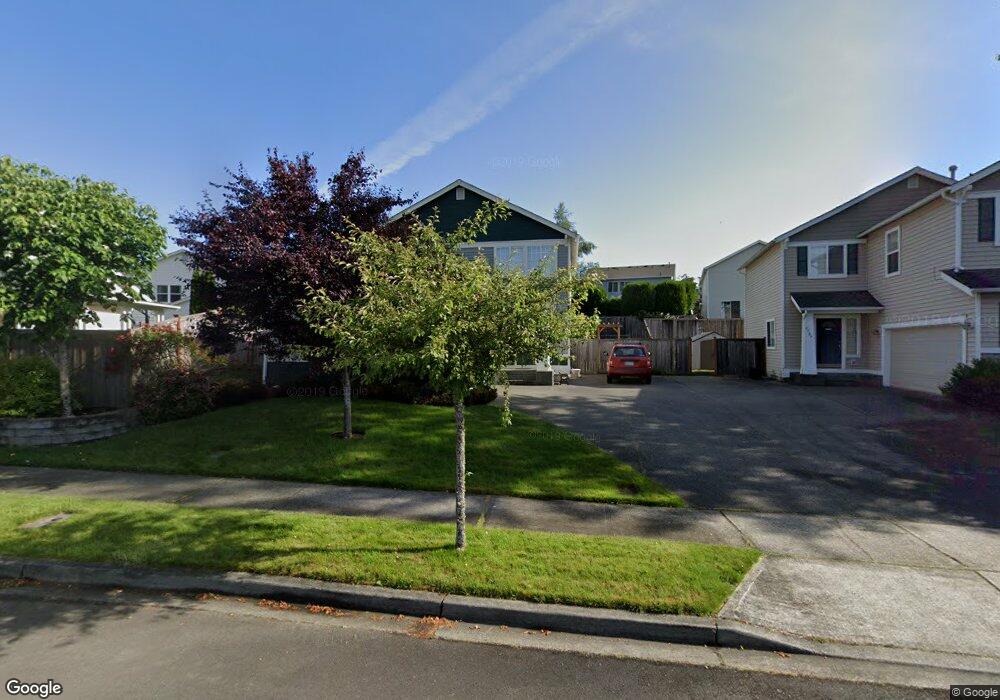
2786 Meyer St Dupont, WA 98327
Estimated Value: $518,000 - $548,000
3
Beds
3
Baths
1,490
Sq Ft
$356/Sq Ft
Est. Value
About This Home
This home is located at 2786 Meyer St, Dupont, WA 98327 and is currently estimated at $530,239, approximately $355 per square foot. 2786 Meyer St is a home located in Pierce County with nearby schools including Chloe Clark Elementary School, Saltars Point Elementary School, and Pioneer Middle School.
Ownership History
Date
Name
Owned For
Owner Type
Purchase Details
Closed on
Apr 25, 2007
Sold by
Sorenson Carolyn
Bought by
Sorenson Abraham
Current Estimated Value
Purchase Details
Closed on
Feb 26, 2002
Sold by
The Quadrant Corp
Bought by
Sorenson Abraham E and Sorenson Carolyn M
Home Financials for this Owner
Home Financials are based on the most recent Mortgage that was taken out on this home.
Original Mortgage
$165,089
Interest Rate
6.8%
Mortgage Type
FHA
Purchase Details
Closed on
Oct 11, 2001
Sold by
Weyerhaeuser Real Estate Company
Bought by
Quadrant Corp
Create a Home Valuation Report for This Property
The Home Valuation Report is an in-depth analysis detailing your home's value as well as a comparison with similar homes in the area
Home Values in the Area
Average Home Value in this Area
Purchase History
| Date | Buyer | Sale Price | Title Company |
|---|---|---|---|
| Sorenson Abraham | -- | None Available | |
| Sorenson Abraham E | $167,680 | Chicago Title | |
| Quadrant Corp | -- | Chicago Title |
Source: Public Records
Mortgage History
| Date | Status | Borrower | Loan Amount |
|---|---|---|---|
| Previous Owner | Sorenson Abraham E | $165,089 |
Source: Public Records
Tax History Compared to Growth
Tax History
| Year | Tax Paid | Tax Assessment Tax Assessment Total Assessment is a certain percentage of the fair market value that is determined by local assessors to be the total taxable value of land and additions on the property. | Land | Improvement |
|---|---|---|---|---|
| 2025 | $3,562 | $483,700 | $235,600 | $248,100 |
| 2024 | $3,562 | $461,800 | $227,000 | $234,800 |
| 2023 | $3,562 | $442,500 | $220,800 | $221,700 |
| 2022 | $3,506 | $449,200 | $220,800 | $228,400 |
| 2021 | $3,299 | $327,500 | $140,300 | $187,200 |
| 2019 | $2,912 | $295,000 | $116,900 | $178,100 |
| 2018 | $3,126 | $284,700 | $116,900 | $167,800 |
| 2017 | $2,796 | $267,700 | $102,400 | $165,300 |
| 2016 | $2,663 | $238,800 | $86,400 | $152,400 |
| 2014 | $2,562 | $236,500 | $86,400 | $150,100 |
| 2013 | $2,562 | $219,600 | $87,900 | $131,700 |
Source: Public Records
Map
Nearby Homes
- 2420 Simmons St Unit B
- 3114 Walker Rd
- 3073 Hoffman Hill Blvd
- 2055 Garry Oaks Ave Unit B
- 1975 Garry Oaks Ave Unit C
- 1375 Foreman Rd
- 3178 Hoffman Hill Blvd
- 3172 Sheaser Way
- 1335 Foreman Rd
- 1305 Foreman Rd
- 1162 Swan Loop
- 3572 Hoffman Hill Blvd
- 1856 Spencer Ct Unit 12F
- 1061 Hiton Cir
- 1607 Kincaid St Unit E-8
- 2176 McDonald Ave
- 1680 Kennedy Place Unit A4
- 2237 Tolmie St
- 2176 Palisade Blvd Unit F-3
- 2147 Hammond Ave Unit B10
- 2764 Meyer St
- 1600 Jensen Ave
- 2742 Meyer St
- 2757 Arnold St
- 2769 Arnold St
- 2741 Arnold St
- 2767 Meyer St
- 2720 Meyer St
- 1598 Jensen Ave
- 2727 Arnold St
- 1696 Jensen Ave
- 2715 Arnold St
- 1584 Jensen Ave
- 1627 Jensen Ave
- 2741 Meyer St
- 1603 Jensen Ave
- 1661 Jensen Ave
- 2701 Arnold St
- 2680 Meyer St
- 1597 Jensen Ave