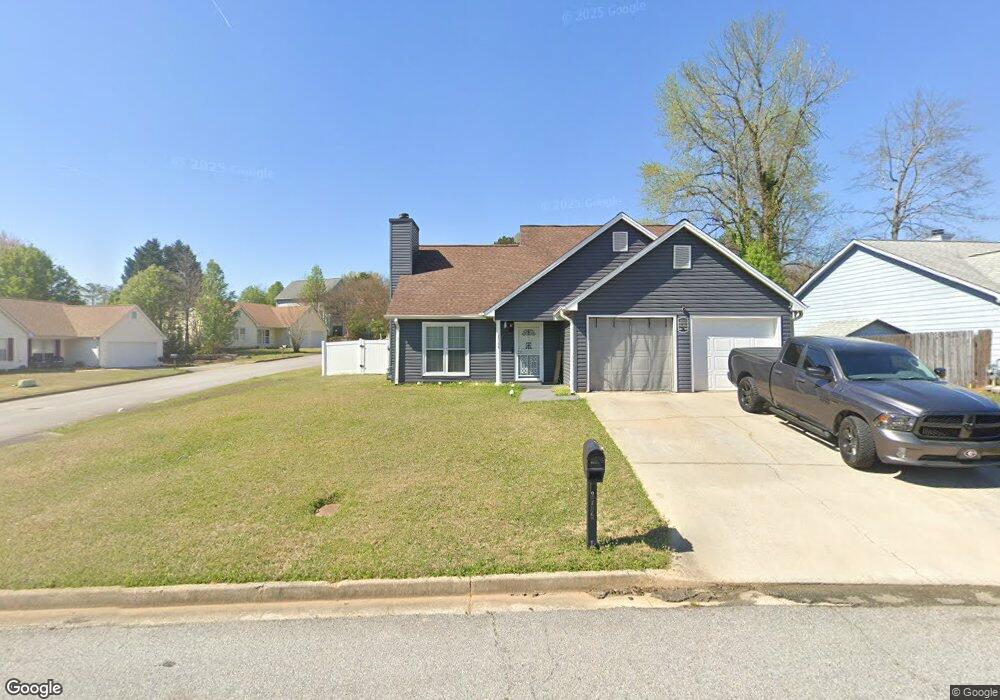
2786 Mill Lake Way Morrow, GA 30260
Estimated Value: $236,752 - $240,000
3
Beds
3
Baths
2,098
Sq Ft
$114/Sq Ft
Est. Value
About This Home
This home is located at 2786 Mill Lake Way, Morrow, GA 30260 and is currently estimated at $238,376, approximately $113 per square foot. 2786 Mill Lake Way is a home located in Clayton County with nearby schools including William M. Mcgarrah Elementary School, Rex Mill Middle School, and Mount Zion High School.
Ownership History
Date
Name
Owned For
Owner Type
Purchase Details
Closed on
Aug 8, 2023
Sold by
Bell Cynthia A
Bought by
Sagoes Cynthia A
Current Estimated Value
Home Financials for this Owner
Home Financials are based on the most recent Mortgage that was taken out on this home.
Original Mortgage
$157,712
Outstanding Balance
$154,217
Interest Rate
6.96%
Mortgage Type
FHA
Estimated Equity
$84,159
Purchase Details
Closed on
Mar 31, 2009
Sold by
Morgan Stanl Trust 2003-Nc10
Bought by
Bell Cynthia A
Purchase Details
Closed on
Feb 5, 2008
Sold by
Stevens Chris P and Stevens Tracy I
Bought by
Deutsche Bank Natl Trust Co
Purchase Details
Closed on
May 2, 1997
Sold by
Torres-Sotomayor Nelson and Torres Mayra
Bought by
Stevens Chris P and Stevens Tracy I
Home Financials for this Owner
Home Financials are based on the most recent Mortgage that was taken out on this home.
Original Mortgage
$86,700
Interest Rate
8.5%
Mortgage Type
VA
Create a Home Valuation Report for This Property
The Home Valuation Report is an in-depth analysis detailing your home's value as well as a comparison with similar homes in the area
Home Values in the Area
Average Home Value in this Area
Purchase History
| Date | Buyer | Sale Price | Title Company |
|---|---|---|---|
| Sagoes Cynthia A | -- | -- | |
| Bell Cynthia A | $47,500 | -- | |
| Deutsche Bank Natl Trust Co | $112,500 | -- | |
| Stevens Chris P | $86,100 | -- |
Source: Public Records
Mortgage History
| Date | Status | Borrower | Loan Amount |
|---|---|---|---|
| Open | Sagoes Cynthia A | $157,712 | |
| Previous Owner | Stevens Chris P | $86,700 |
Source: Public Records
Tax History Compared to Growth
Tax History
| Year | Tax Paid | Tax Assessment Tax Assessment Total Assessment is a certain percentage of the fair market value that is determined by local assessors to be the total taxable value of land and additions on the property. | Land | Improvement |
|---|---|---|---|---|
| 2024 | $3,388 | $85,880 | $8,000 | $77,880 |
| 2023 | $1,670 | $73,200 | $8,000 | $65,200 |
| 2022 | $2,363 | $69,240 | $8,000 | $61,240 |
| 2021 | $1,841 | $55,640 | $8,000 | $47,640 |
| 2020 | $1,570 | $48,309 | $8,000 | $40,309 |
| 2019 | $1,449 | $44,752 | $6,400 | $38,352 |
| 2018 | $1,283 | $40,672 | $6,400 | $34,272 |
| 2017 | $854 | $30,063 | $6,400 | $23,663 |
| 2016 | $677 | $25,707 | $6,400 | $19,307 |
| 2015 | $676 | $0 | $0 | $0 |
| 2014 | $701 | $26,661 | $6,400 | $20,261 |
Source: Public Records
Map
Nearby Homes
- 2783 Mill Lake Way
- 6486 Aquila Dr
- 2845 Heritage Ln
- 6397 E Meyer Dr
- 2756 Brook Dr
- 2933 Bretton Dr
- 6485 Bobolink Ct
- 6584 Sleepy Hollow Ln
- 2613 Stratford Ln Unit 3
- 2617 Terrace Pkwy
- 2577 Castile Dr
- 2881 Panther Ct
- 2649 Lake Harbin Rd
- 6389 Warbler Ct
- 6383 Warbler Ct
- 6379 Warbler Ct
- 6387 Warbler Ct
- 6385 Warbler Ct
- 6381 Warbler Ct
- 6377 Warbler Ct
- 2792 Mill Lake Way Unit 1
- 6500 Pine Grove Ct
- 0 Pine Grove Ct Unit 7524371
- 0 Pine Grove Ct Unit 7226158
- 0 Pine Grove Ct Unit 7200974
- 0 Pine Grove Ct Unit 7134590
- 0 Pine Grove Ct Unit 3226548
- 0 Pine Grove Ct Unit 8674077
- 0 Pine Grove Ct Unit 8372647
- 0 Pine Grove Ct
- 2810 Mill Lake Way
- 6494 Pine Grove Ct
- 6515 Pine Grove Ct
- 6509 Pine Grove Ct
- 6499 Pine Grove Ct
- 2787 Mill Lake Way Unit 1
- 2814 Mill Lake Way
- 2791 Mill Lake Way
- 6493 Pine Grove Ct Unit 2
- 6488 Pine Grove Ct Unit 2