Estimated Value: $406,000 - $436,000
4
Beds
2
Baths
1,654
Sq Ft
$255/Sq Ft
Est. Value
About This Home
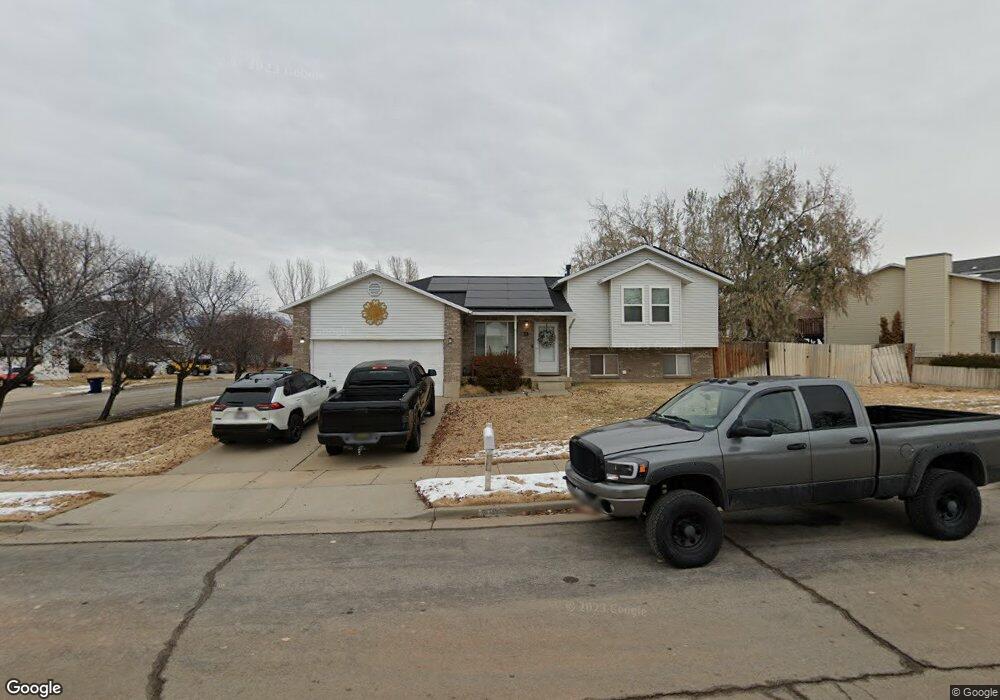
This home is located at 2786 W 4375 S, Roy, UT 84067 and is currently estimated at $422,463, approximately $255 per square foot. 2786 W 4375 S is a home located in Weber County with nearby schools including Midland School, Sand Ridge Junior High School, and Roy High School.
Ownership History
Date
Name
Owned For
Owner Type
Purchase Details
Closed on
Sep 2, 2022
Sold by
Thompson Alesha M
Bought by
Lacey Marcus and Lacey Alesha
Current Estimated Value
Purchase Details
Closed on
Sep 16, 2016
Sold by
Parish Robert D
Bought by
Thompson Alesha M
Home Financials for this Owner
Home Financials are based on the most recent Mortgage that was taken out on this home.
Original Mortgage
$5,000
Interest Rate
3.45%
Mortgage Type
Unknown
Purchase Details
Closed on
Nov 29, 2007
Sold by
Frost Trinity N and Frost Darrin B
Bought by
Parish Robert D
Home Financials for this Owner
Home Financials are based on the most recent Mortgage that was taken out on this home.
Original Mortgage
$162,450
Interest Rate
6.36%
Mortgage Type
FHA
Purchase Details
Closed on
Jan 20, 1999
Sold by
Rizzuto Joe R and Rizzuto Lynette
Bought by
Frost Darrin B and Frost Trinity N
Home Financials for this Owner
Home Financials are based on the most recent Mortgage that was taken out on this home.
Original Mortgage
$107,000
Interest Rate
6.63%
Create a Home Valuation Report for This Property
The Home Valuation Report is an in-depth analysis detailing your home's value as well as a comparison with similar homes in the area
Home Values in the Area
Average Home Value in this Area
Purchase History
| Date | Buyer | Sale Price | Title Company |
|---|---|---|---|
| Lacey Marcus | -- | Lincoln Title | |
| Thompson Alesha M | -- | First American | |
| Parish Robert D | -- | First American Riverdale | |
| Frost Darrin B | -- | Associated Title |
Source: Public Records
Mortgage History
| Date | Status | Borrower | Loan Amount |
|---|---|---|---|
| Previous Owner | Thompson Alesha M | $5,000 | |
| Previous Owner | Thompson Alesha M | $154,212 | |
| Previous Owner | Parish Robert D | $162,450 | |
| Previous Owner | Frost Darrin B | $107,000 |
Source: Public Records
Tax History
| Year | Tax Paid | Tax Assessment Tax Assessment Total Assessment is a certain percentage of the fair market value that is determined by local assessors to be the total taxable value of land and additions on the property. | Land | Improvement |
|---|---|---|---|---|
| 2025 | $265 | $384,924 | $135,012 | $249,912 |
| 2024 | $2,347 | $204,049 | $74,256 | $129,793 |
| 2023 | $250 | $191,400 | $71,317 | $120,083 |
| 2022 | $2,473 | $223,850 | $60,501 | $163,349 |
| 2021 | $1,955 | $289,000 | $75,002 | $213,998 |
| 2020 | $1,901 | $259,000 | $75,002 | $183,998 |
| 2019 | $1,799 | $230,000 | $49,906 | $180,094 |
| 2018 | $1,648 | $197,000 | $44,976 | $152,024 |
| 2017 | $1,502 | $167,000 | $43,029 | $123,971 |
| 2016 | $1,459 | $87,288 | $24,773 | $62,515 |
| 2015 | $1,344 | $82,031 | $24,773 | $57,258 |
| 2014 | $1,206 | $71,538 | $21,944 | $49,594 |
Source: Public Records
Map
Nearby Homes
- 4297 Westlake Dr
- 2815 W 4275 S
- 4374 S 2900 W
- 2777 W 4175 S Unit 229
- 4270 S 2900 W
- 2979 W 4275 S
- 4248 S 2400 W
- 2892 W 3975 S Unit 40C
- 2817 W 3965 S Unit 63D
- 2673 W 3900 S
- 3963 S 2925 W
- 4732 S West Park Dr
- 2602 W 3900 S
- 3077 W 4650 S
- 3860 S Midland Dr Unit B 51
- 3114 S 3175 W Unit 21
- 4435 Cross Creek Rd Unit 29C
- 4328 S 2175 W
- 3229 W 3855 S
- 4891 S 2875 W