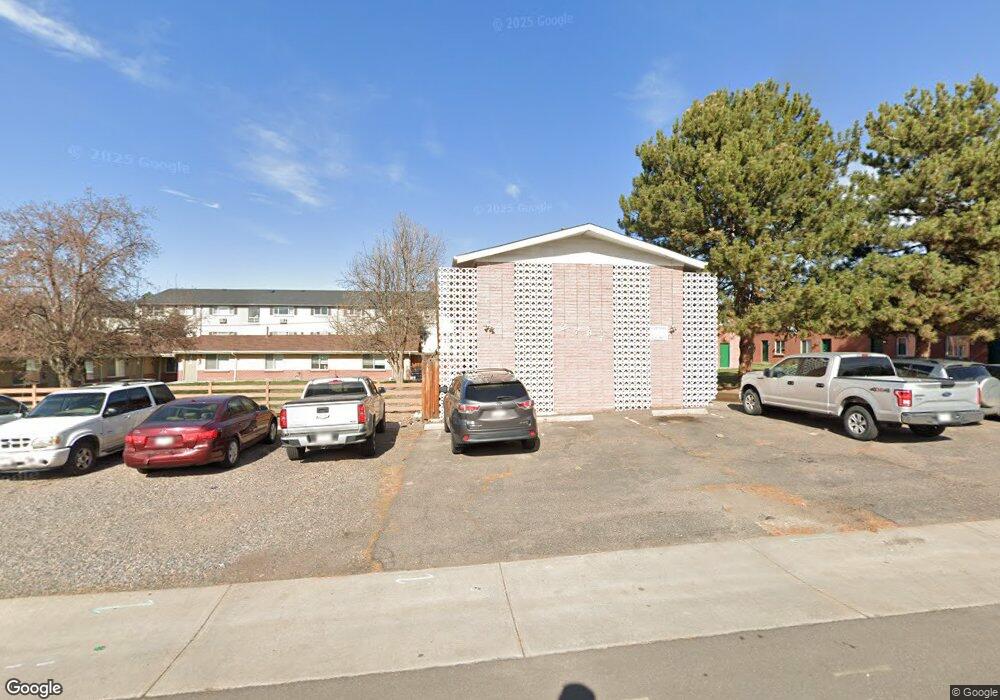
2787 Harlan St Unit 11 Wheat Ridge, CO 80214
Barths NeighborhoodEstimated Value: $183,000 - $236,713
2
Beds
1
Bath
900
Sq Ft
$236/Sq Ft
Est. Value
About This Home
This home is located at 2787 Harlan St Unit 11, Wheat Ridge, CO 80214 and is currently estimated at $212,178, approximately $235 per square foot. 2787 Harlan St Unit 11 is a home located in Jefferson County with nearby schools including Edgewater Elementary School, Jefferson High School, and Beth Eden Baptist School.
Ownership History
Date
Name
Owned For
Owner Type
Purchase Details
Closed on
Sep 19, 2023
Sold by
Fillion Paul L
Bought by
Pacific Premier Trust and Douglas Michaels Ira
Current Estimated Value
Purchase Details
Closed on
Jul 23, 2008
Sold by
Fannie Mae
Bought by
Fillion Paul L and Fillion Lisa J
Purchase Details
Closed on
May 22, 2007
Sold by
Ray Darrin
Bought by
Aurora Loan Services Llc
Purchase Details
Closed on
Apr 13, 2007
Sold by
Aurora Loan Services Llc
Bought by
Federal National Mortgage Association
Purchase Details
Closed on
Mar 17, 2006
Sold by
2787 Harlan Llc
Bought by
Ray Darrin
Home Financials for this Owner
Home Financials are based on the most recent Mortgage that was taken out on this home.
Original Mortgage
$131,920
Interest Rate
8.25%
Mortgage Type
Fannie Mae Freddie Mac
Create a Home Valuation Report for This Property
The Home Valuation Report is an in-depth analysis detailing your home's value as well as a comparison with similar homes in the area
Home Values in the Area
Average Home Value in this Area
Purchase History
| Date | Buyer | Sale Price | Title Company |
|---|---|---|---|
| Pacific Premier Trust | $190,000 | None Listed On Document | |
| Fillion Paul L | $26,500 | Security Title | |
| Aurora Loan Services Llc | $139,684 | None Available | |
| Federal National Mortgage Association | -- | None Available | |
| Ray Darrin | $164,900 | Security Title |
Source: Public Records
Mortgage History
| Date | Status | Borrower | Loan Amount |
|---|---|---|---|
| Previous Owner | Ray Darrin | $131,920 |
Source: Public Records
Tax History Compared to Growth
Tax History
| Year | Tax Paid | Tax Assessment Tax Assessment Total Assessment is a certain percentage of the fair market value that is determined by local assessors to be the total taxable value of land and additions on the property. | Land | Improvement |
|---|---|---|---|---|
| 2024 | $837 | $9,574 | $7,538 | $2,036 |
| 2023 | $837 | $9,574 | $7,538 | $2,036 |
| 2022 | $1,331 | $14,949 | $5,213 | $9,736 |
| 2021 | $1,349 | $15,379 | $5,363 | $10,016 |
| 2020 | $1,220 | $13,970 | $4,290 | $9,680 |
| 2019 | $1,203 | $13,970 | $4,290 | $9,680 |
| 2018 | $987 | $11,081 | $3,600 | $7,481 |
| 2017 | $892 | $11,081 | $3,600 | $7,481 |
| 2016 | $720 | $8,374 | $2,706 | $5,668 |
| 2015 | $624 | $8,994 | $2,706 | $6,288 |
| 2014 | $624 | $6,806 | $2,229 | $4,577 |
Source: Public Records
Map
Nearby Homes
- 2685 Gray St
- 2890 N Harlan St Unit 102
- 6000 W 29th Ave
- 6106 W 28th Ct
- 2598 Harlan St Unit 1
- 2845 Fenton St
- 2570 Jay St
- 2777 Kendall St
- 2568 Eaton St
- 2577 Depew St
- 2946 Fenton St
- 2915 Depew St
- 2902 Depew St
- 6505 W 25th Ln
- 3022 Fenton St
- 2461 Depew St
- 3019 Chase St
- 2455 Chase St
- 2933 Benton St
- 2243 N Harlan St
- 2787 Harlan St Unit 12
- 2787 Harlan St Unit 10
- 2787 Harlan St Unit 9
- 2787 Harlan St Unit 8
- 2787 Harlan St Unit 7
- 2787 Harlan St Unit 6
- 2787 Harlan St Unit 5
- 2787 Harlan St Unit 4
- 2787 Harlan St Unit 3
- 2787 Harlan St Unit 2
- 2787 Harlan St Unit 1
- 2787 Harlan St
- 2787 Harlan St Unit S 3 AND 4
- 2711 Harlan St
- 2800 Harlan St
- 2820 Harlan St
- 2701 Harlan St
- 2660 Ingalls St
- 2840 Harlan St
- 2695 Gray St