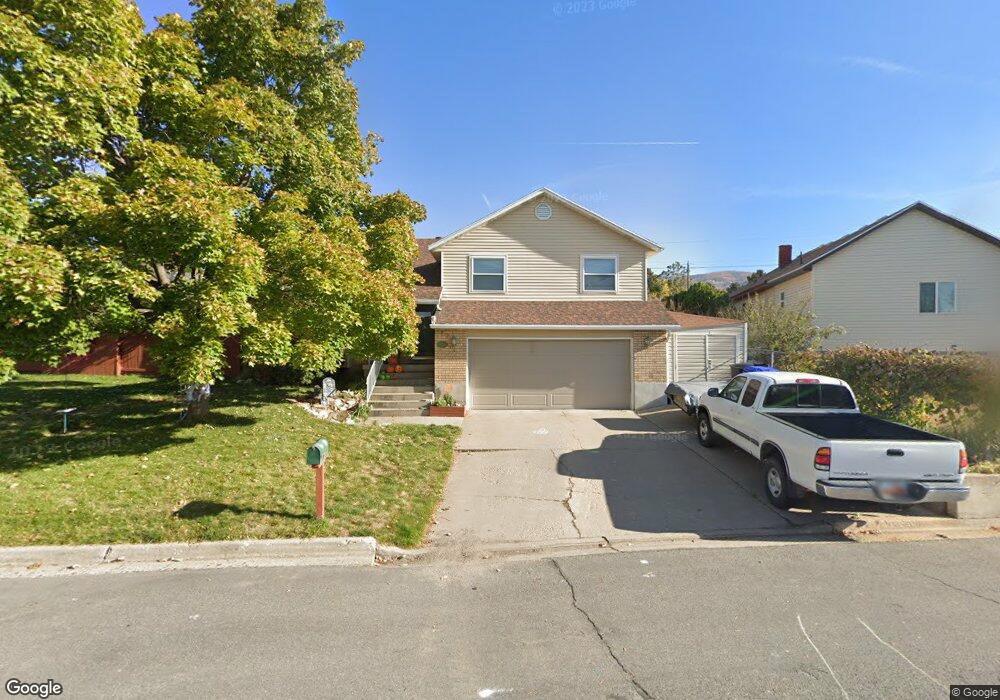
2787 Southview Cir Bountiful, UT 84010
Estimated Value: $490,000 - $521,000
4
Beds
3
Baths
1,868
Sq Ft
$270/Sq Ft
Est. Value
About This Home
This home is located at 2787 Southview Cir, Bountiful, UT 84010 and is currently estimated at $503,869, approximately $269 per square foot. 2787 Southview Cir is a home with nearby schools including Boulton School, South Davis Junior High School, and Woods Cross High School.
Ownership History
Date
Name
Owned For
Owner Type
Purchase Details
Closed on
Apr 4, 2003
Sold by
Devries Craig and Devries Laura
Bought by
Devries Craig B and Devries Laura K
Current Estimated Value
Home Financials for this Owner
Home Financials are based on the most recent Mortgage that was taken out on this home.
Original Mortgage
$153,900
Outstanding Balance
$58,841
Interest Rate
4.37%
Estimated Equity
$445,028
Purchase Details
Closed on
Apr 3, 2003
Sold by
White Rebecca R and Holgreen Rebecca White
Bought by
Devries Craig and Devries Laura
Home Financials for this Owner
Home Financials are based on the most recent Mortgage that was taken out on this home.
Original Mortgage
$153,900
Outstanding Balance
$58,841
Interest Rate
4.37%
Estimated Equity
$445,028
Purchase Details
Closed on
Nov 24, 1997
Sold by
White Brenden R
Bought by
White Rebecca R
Home Financials for this Owner
Home Financials are based on the most recent Mortgage that was taken out on this home.
Original Mortgage
$128,000
Interest Rate
8.37%
Create a Home Valuation Report for This Property
The Home Valuation Report is an in-depth analysis detailing your home's value as well as a comparison with similar homes in the area
Purchase History
| Date | Buyer | Sale Price | Title Company |
|---|---|---|---|
| Devries Craig B | -- | Backman Stewart Title Servic | |
| Devries Craig | -- | Backman Stewart Title Servic | |
| White Rebecca R | -- | Associated Title Company |
Source: Public Records
Mortgage History
| Date | Status | Borrower | Loan Amount |
|---|---|---|---|
| Open | Devries Craig B | $153,900 | |
| Previous Owner | White Rebecca R | $128,000 |
Source: Public Records
Tax History Compared to Growth
Tax History
| Year | Tax Paid | Tax Assessment Tax Assessment Total Assessment is a certain percentage of the fair market value that is determined by local assessors to be the total taxable value of land and additions on the property. | Land | Improvement |
|---|---|---|---|---|
| 2025 | $2,792 | $255,200 | $86,350 | $168,850 |
| 2024 | $2,658 | $246,950 | $62,150 | $184,800 |
| 2023 | $2,528 | $423,000 | $113,000 | $310,000 |
| 2022 | $2,527 | $237,600 | $57,200 | $180,400 |
| 2021 | $2,284 | $329,000 | $86,000 | $243,000 |
| 2020 | $1,995 | $288,000 | $78,300 | $209,700 |
| 2019 | $1,976 | $282,000 | $80,750 | $201,250 |
| 2018 | $1,830 | $257,000 | $165,750 | $91,250 |
| 2016 | $1,446 | $115,611 | $91,163 | $24,448 |
| 2015 | $1,196 | $90,365 | $46,750 | $43,615 |
| 2014 | $1,519 | $117,439 | $46,750 | $70,689 |
| 2013 | -- | $104,522 | $46,750 | $57,772 |
Source: Public Records
Map
Nearby Homes
- 2749 S 450 W
- 528 W 2900 S
- 544 W 2900 S
- 3126 Applewood Dr
- 527 Applewood Dr
- 3088 S 100 W
- 2848 Holbrook Rd
- 19 E North Canyon Rd
- 2913 S Davis Blvd
- 69 E North Canyon Rd
- 2095 S Main St Unit 23
- 757 W 3200 S
- 1950 S 200 W Unit 32
- 8 E 3500 S
- 1940 S 200 W Unit 6
- 2184 Sorrento Dr
- 294 Springridge Dr
- 298 Percival St Unit 354
- 260 E 1100 N
- 3716 S Oakridge Cir
- 2806 Orchard Dr
- 2816 Orchard Dr
- 2782 Orchard Dr
- 371 W 2725 S
- 2819 Southview Cir
- 2784 Southview Cir
- 2812 Southview Cir
- 374 W 2725 S
- 2828 Orchard Dr
- 2792 Southview Cir
- 2828 S Orchard Dr
- 373 W 2725 S
- 2725 Orchard Dr
- 2856 S 400 W
- 2746 Orchard Dr
- 2837 S 400 W
- 2746 S Orchard Dr
- 372 W 2725 S
- 2883 S 450 W
- 2819 S 450 W